Guide to Geospatial Technology
Harness the latest tools to achieve your underwriting goals

Geospatial tools offer you a new, comprehensive and straightforward way of looking at risk.
How to use this guide
This page introduces the conceptual nature and practical application of geospatial tools, illustrating how they can revolutionize the industry, reduce losses, and power sales. Provided here are links to additional resources to further explain the nature of geospatial tools and their benefits.
Whether it is related to earthquake or cannabis, risk is always evolving. Traditional methods of risk management are lagging behind and it is crucial that the insurance industry embrace new tools to better handle the ever-changing nature of risk.
BuildingMetrix® is proud to be a part of WSRB which has inspected properties, evaluated communities, and helped insurance companies understand and underwrite risks in Washington state for over 125 years. While WSRB's original focus was fire risk data, BuildingMetrix was created to help our customers understand new and evolving risks using efficient, modern tools.
Partnering with BuildingMetrix gives you access to valuable solutions, industry knowledge, and friendly, knowledgeable service for properties throughout the United States. Learn more about what we offer here.
Terminology
Before we start, let's cover some terminology you should be familiar with.
Geospatial data:
Data that relates directly to specific geographical locations on or near the earth’s surface.1 These points can be anything from bodies of water and topographical formations to cities, neighborhoods, individual buildings, and other elements of man-made infrastructure. In short: if something exists as a point on a map, it can exist as a piece of geospatial data.
Geospatial data points often combine location information (the latitude/longitude coordinates which can either be static or dynamic), attribute information (the characteristics of the point/object), and temporal information (the time at which both the location and attributes exist).2
Geospatial information systems (GIS):
Computer systems that capture, analyze, and visually display geospatial data, often in the form of a map.3
Mapping out risk
How and why does high concentration of risk occur?
High concentrations of risk often occur because an insurer hasn’t found a way to quickly identify the total amount of risk it has written. When individual underwriters acquire only a small share of an area’s business, the insurer can’t easily track what all the underwriters operating in that area are doing. As a result, the insurer does not see the total amount of risk or the overall impact on its book of business.
To illustrate this problem, look at the following example.
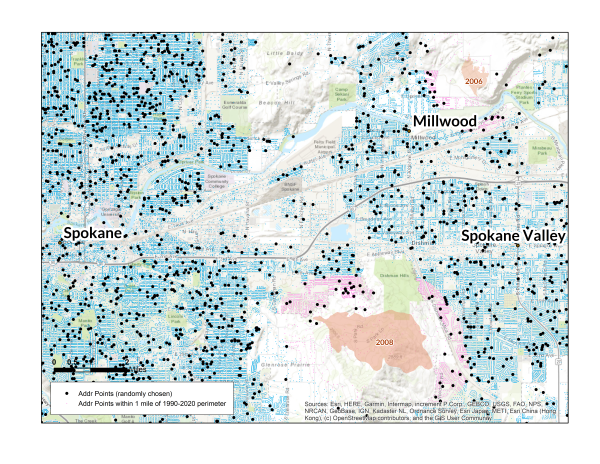
Imagine a hypothetical book of business wherein several underwriters are writing policies in the same area – let’s use the Spokane, WA area as an example.
One of the underwriters has written policies on just .1% of all address points in the region, properties which are indicated by the black dots on this first map.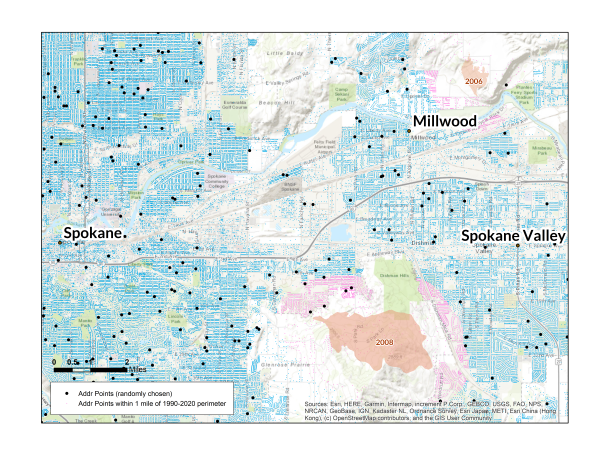 The next underwriter has covered .3% of the addresses in the area.
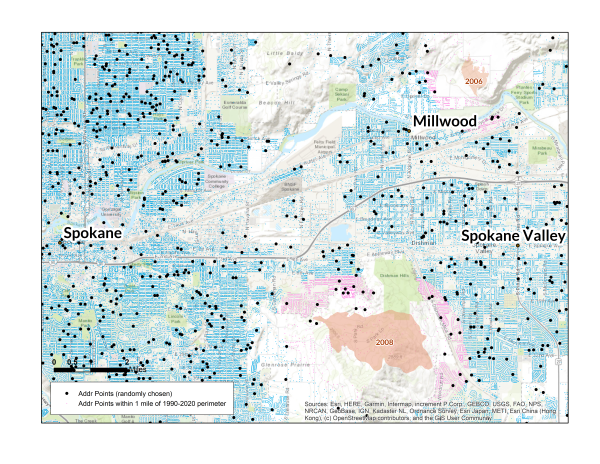 This insurer has a total of ten underwriters covering the Spokane area – five of them cover .1% of properties and five of them cover .3% of properties – and have written policies on 2% of the total properties in the area. Anything over 1% is considered high concentration.
There currently exist two paths you can take to tackle concentration of risk.
Geospatial tools give you the ability to visualize risk geographically.
Traditional vs. new methods
Let’s explore these two methods and see which one can provide a greater benefit to you and your company.
Traditional methods
The primary tool used by insurers is the spreadsheet. Spreadsheets can allow some risk analysis such as distance to hazard and zip-code-based analysis to assess risk exposure. Though they are helpful for aggregating data in one place and generating useful insights, spreadsheets do not afford underwriters the ability to quickly visualize and analyze property-related data geographically and in relation to nearby exposures.
Spreadsheets can be flawed because they are either too broad or narrow in their focus. Here are some examples of why…
1) Zip codes are not geographic boundaries; instead, they are a collection of routes used for postal delivery - when used in data analysis, they often mask real insights. Check out our two-part series, "Zip Code Insurance Rating", and learn why zip codes alone don't provide the right data:
- Part I: ZIP Code Accuracy
- Part II: Measuring Property Risk
2) Spreadsheets rely on single points to assess an area's risk – large properties, places like corporate campuses, retirement communities, golf courses, farms, vineyards, and shopping malls, are often given a single address, hiding the scope of the property and its proximity to risk.
3) Individual properties with addresses that appear to be unique can, in reality, be extremely close together, increasing the concentration of risk and the potential for oversaturation.
Traditional methods lack the ability to be continuously updated as new risk information becomes available. Insurers have relied on their reinsurers to help them measure and manage their concentration of risk historically, but utilizing these annual or semi-annual checks of a book of business does not stay up to date with quickly changing risks.
The new way
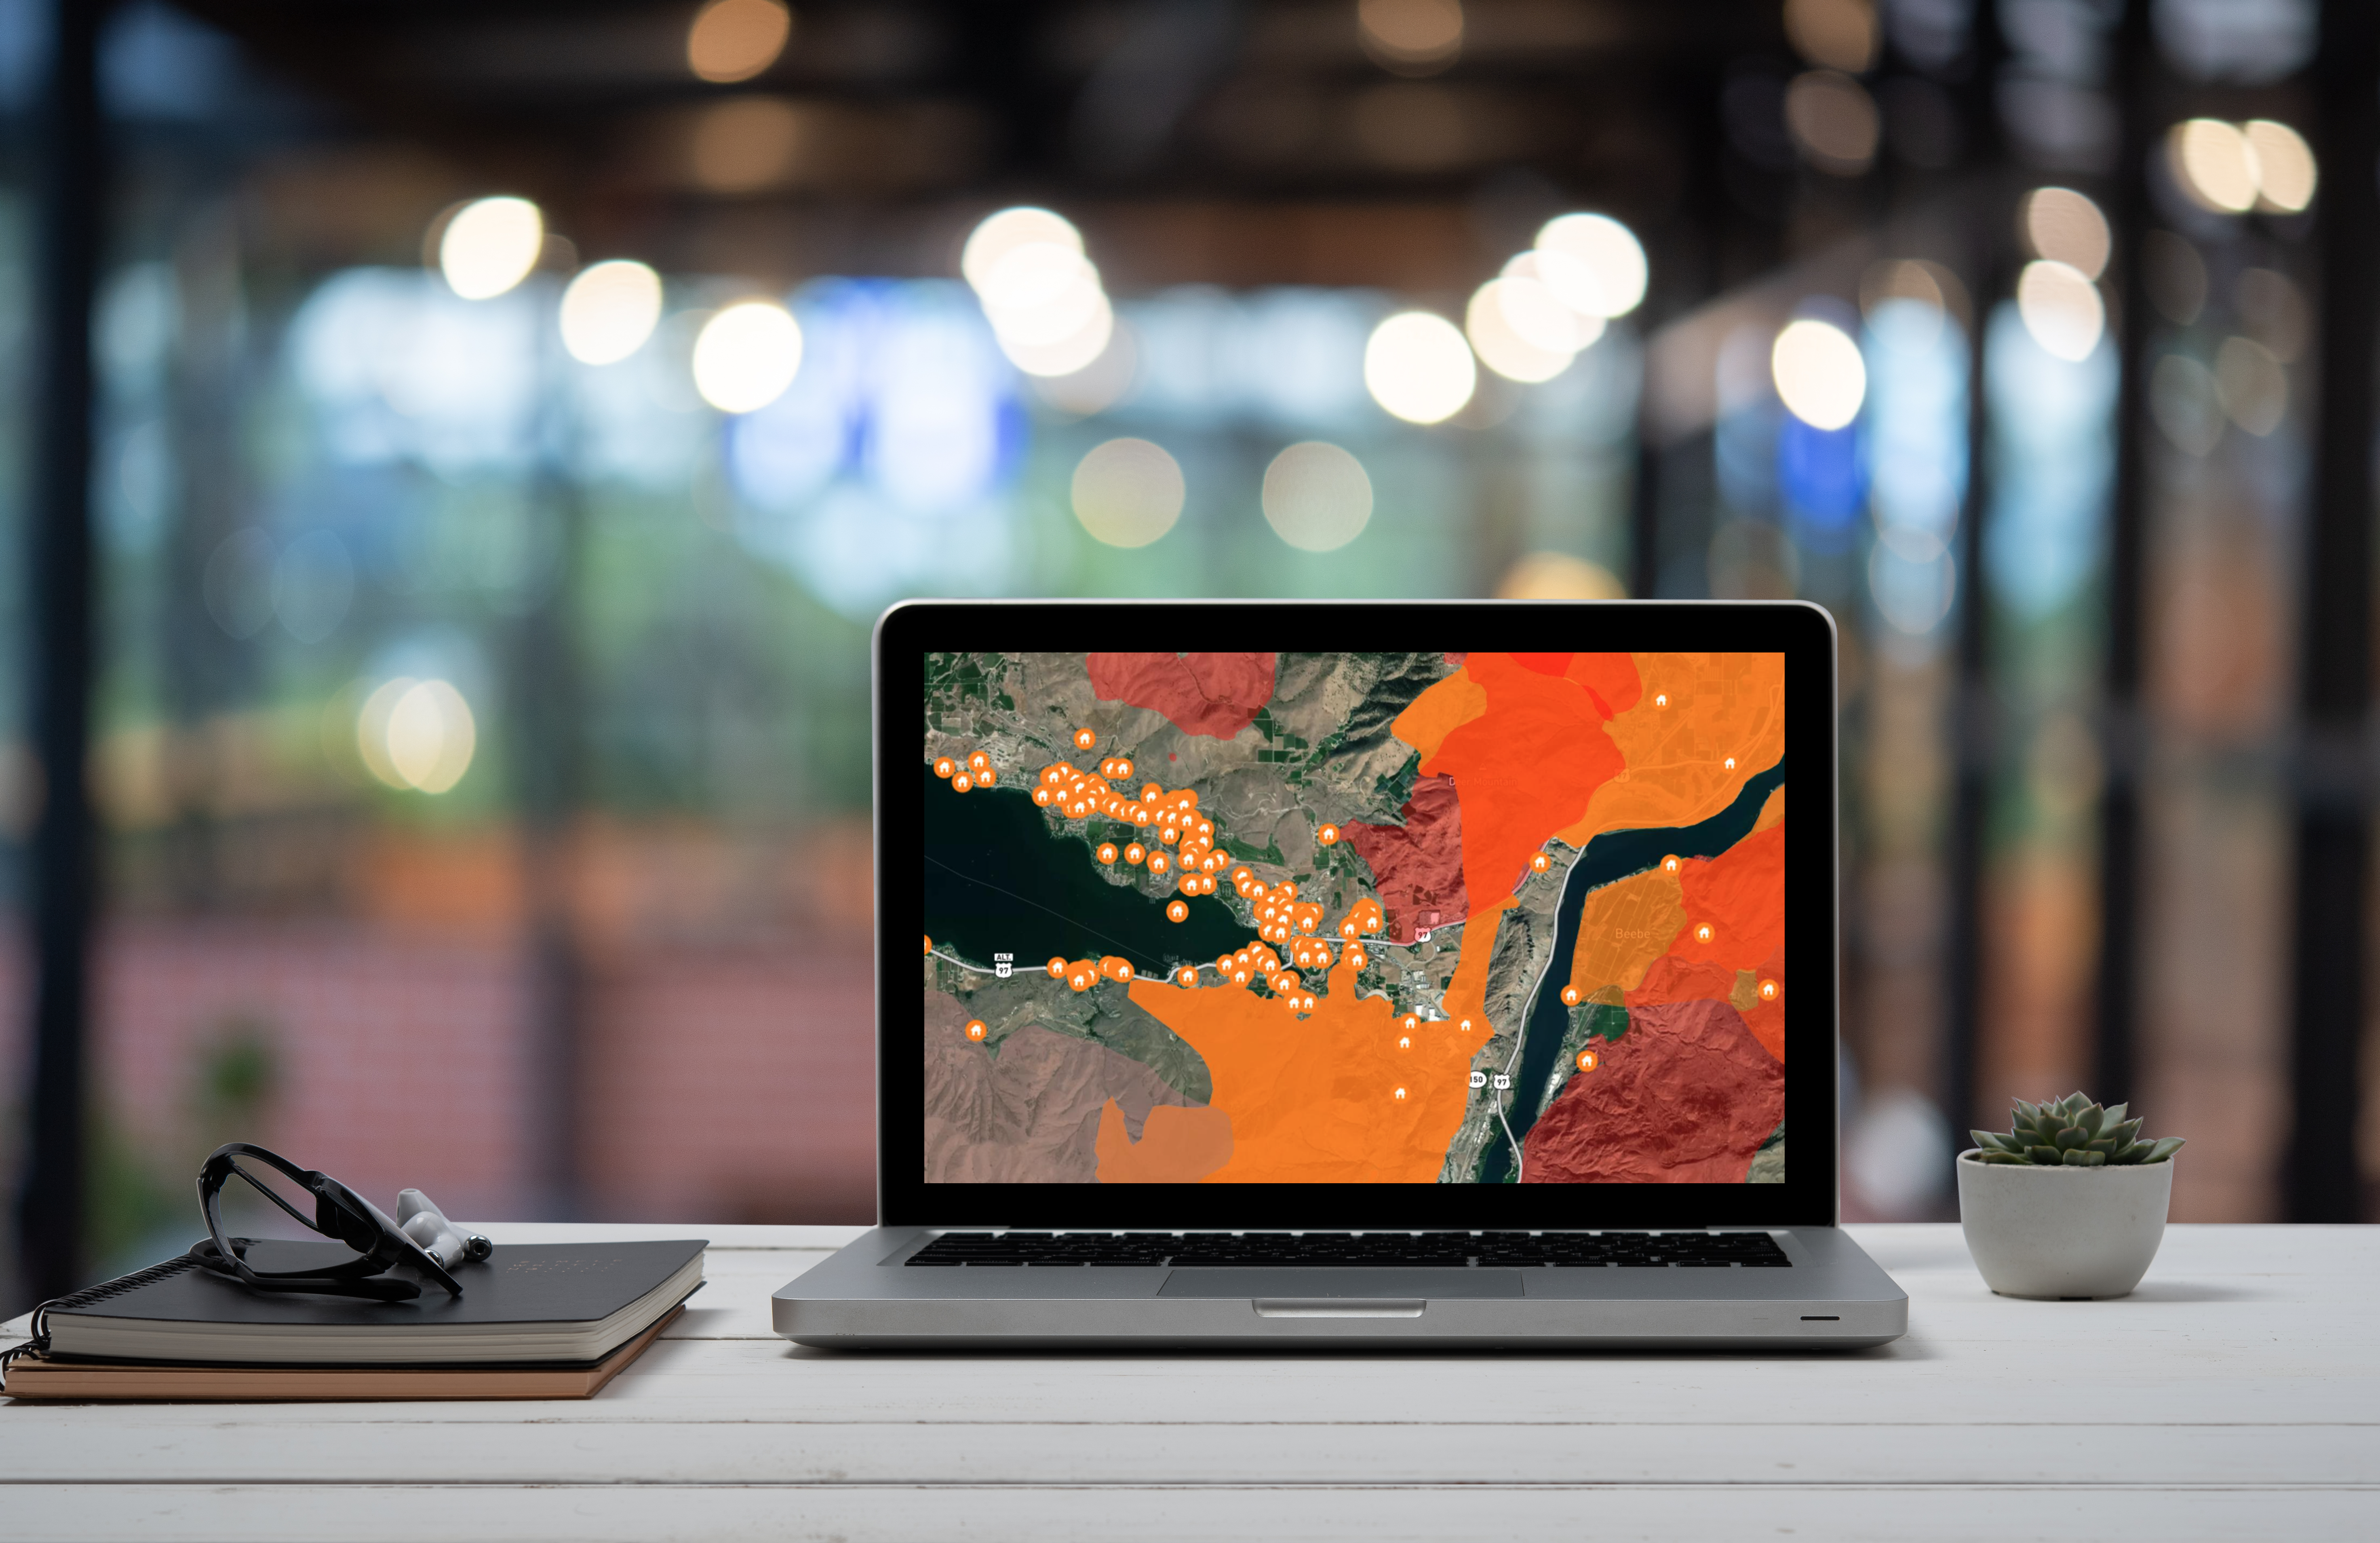
Geospatial mapping tools help insurers visualize the location of risks and their proximity to each other, removing artificial boundaries, offering a more complete look at exposure, and creating opportunities to improve risk management.
Spreadsheets can offer flawed analysis of nearby exposures; maps are crystal clear, showing you where the properties exist in your book of business and exactly how close they are to potential exposures, both current and historical. While this data can in fact be gleaned from traditional methods, using geospatial tools will save underwriters valuable time and effort, allowing them to be more effective in their workflows.
Benefits of our geospatial tools
Real-time updates
Conditions change in between reinsurance reviews, and it is important to have a picture of risk that updates based on what is happening in the world.

BuildingMetrix has teamed up with GIA Map to provide you with geospatial tools that incorporate real-time updates. In conjunction with historical data, GIA Map provides real-time map layers for 40+ natural hazard perils. With GIA Map, you can map an address and quickly view your individual risk and understand the hazards around them. GIA Map offers you complete control of how many properties you want in a geographic area by allowing you to set the rules and receive alerts when you have exceeded the maximum. GIA Map is extremely customizable and is currently being used successfully by a number of companies to manage their risk aggregation for reinsurance purchases and many distinct hazards.
Data aggregation
Our geospatial tools aggregate all data in one place, combining data from your book of business with historical risk data and real-time updates.
Additionally, our tools offer a sleek all-in-one interface that is easy to navigate and learn how to use. Our tools are simple to utilize effectively and API integration means the insights automatically merge with your underwriting workflow.
Single point solution
Maps also solve the problem of the single point, narrow focus - maps allow underwriters to see the greater whole. All associated hazards can be viewed at one time, leading to better underwriting and pricing decisions.
Let’s use a golf course in your book of business as an example. Using traditional, spreadsheet-based methods, the address of the course would give no indication of the size or scope of the property. Geospatial mapping, however, shows that the address in question is much bigger than initially indicated, revealing its potential proximity to other properties and exposures nearby.
Help your customers
Geospatial tools help you uncover customers who are most at risk of loss, pinpointing them to provide greater assistance in two ways. First, by educating customers about their individual property's risk so they understand their premiums may increase and why. And second, by informing customers about effective mitigation strategies.
Power sales
The perspective gained through geospatial tools gives you a clearer picture of which markets should be targeted for new business, allowing you to diversify your risk type and limit your concentration of risk in a single area.
Other benefits
In addition to the benefits listed above, our geospatial tools give you the ability to:
1) Increase accuracy when estimating the cost of catastrophic events, allowing you to adjust premiums and boost profitability.
2) Prepare for reinsurance reviews with a clear picture of your risk saturation, giving you the upper hand to secure favorable reinsurance terms.
3) Identify adverse selection at the agency level or in your overall book of business.
BuildingMetrix Suite: Our geospatial tools
Carefully developed by a team of insurance industry veterans, every BuildingMetrix data product helps you make a better underwriting decision or grow your agency. You get valuable information you can use to enhance your business results, along with easy-to-understand explanations of every data element. And if you have questions, we’re here to help, with one of the friendliest, most knowledgeable customer service teams in the industry.
Provides users a complete report on a property's slope and the buildings plotted out with respect to that slope, enabling complete geospatial knowledge of a property in the shortest amount of time possible to correctly price their policies with ease.
Learn More→
How close are legal cannabis businesses to properties you insure or are considering insuring? Find out fast so you can make an informed underwriting decision and clearly see your concentration of risk.
Learn More→
Hemp is now legal at the federal level, but it still comes with significant risks, including explosion and theft. Find out if a property you insure is a hemp grower or processor and take action — before a claim is filed.
Learn More→
Designed to help principals grow their agencies by making cross-selling earthquake coverage easier than ever. Also offers valuable insight for underwriters because earthquakes are a major risk factor for fire.
Learn More→
As demand grows for long-term home care, more and more licensed adult home care facilities could be making their way into your book of business. With our data, determine your exposure and ensure your customers get the coverage they need.
Learn More→

There are nearly 80,000 federally licensed firearms dealers in the United States. Uncover firearms sellers in your book of business in order to make effective underwriting decisions.
Learn More→

URM buildings lack tensile strength, making them prone to collapse, especially in earthquake-prone regions. Targeting properties in your book empowers you to make insightful underwriting assessments.
Learn More→

Insurers covering historic buildings can face significant expenses due to increased vulnerability and a range of cost drivers. Pinpoint properties to ensure proper coverage.
Learn More→

To effectively offer coverage for these operations, insurers need a clear understanding of their risk concentration to effectively manage their exposure.
Learn More→

The liabilities tied to liquor service are varied and often hidden from traditional property data sources. Identify properties in your book associated with active liquor licenses and recorded violations.
Learn More→

Commercial and residential properties are increasingly installing charging stations to accommodate the surge as more and more electric vehicles take to the road, bringing with them a unique set of risks to insurers.
Learn More→
Interested?
We’d love to talk with you and show you how the right tool can revolutionize the way you look at risk concentration. Contact us today to schedule a demo.
[1] Cambridge, https://dictionary.cambridge.org/us/dictionary/english/geospatial