
Increasingly common and destructive wildfires in many parts of the U.S. mean property insurers face heightened challenges, and one challenge is that insurers may be taking on more risk in wildfire-prone areas than they realize. High concentrations of wildfire risk in one area may go overlooked for months, can make reinsurance reviews more time-consuming to prepare for, and can even affect the financial stability of the insurer.
What causes high concentrations of wildfire risk?
High concentrations of wildfire risk often occur because an insurer hasn’t found a way to quickly identify the total amount of wildfire risk it has taken on. Each individual underwriter may acquire only a small share of a wildfire-prone area’s business, and the insurer can’t easily track what all the underwriters operating in that area are doing. As a result, the insurer doesn’t see the total amount of risk it’s assuming or the overall impact on its book of business.
That impact is now growing because wildfire risk is evolving, driven by climate change, forest management practices, and increased development in wildfire-prone areas. Most insurers generate or purchase wildfire risk scores to assess a property before insuring it, but the evolution in wildfire risk means that wildfires are now happening in areas with acceptable scores. Over the past several years, we’ve seen wildfires burn outside Portland, Oregon, and on the Olympic Peninsula in Washington state.
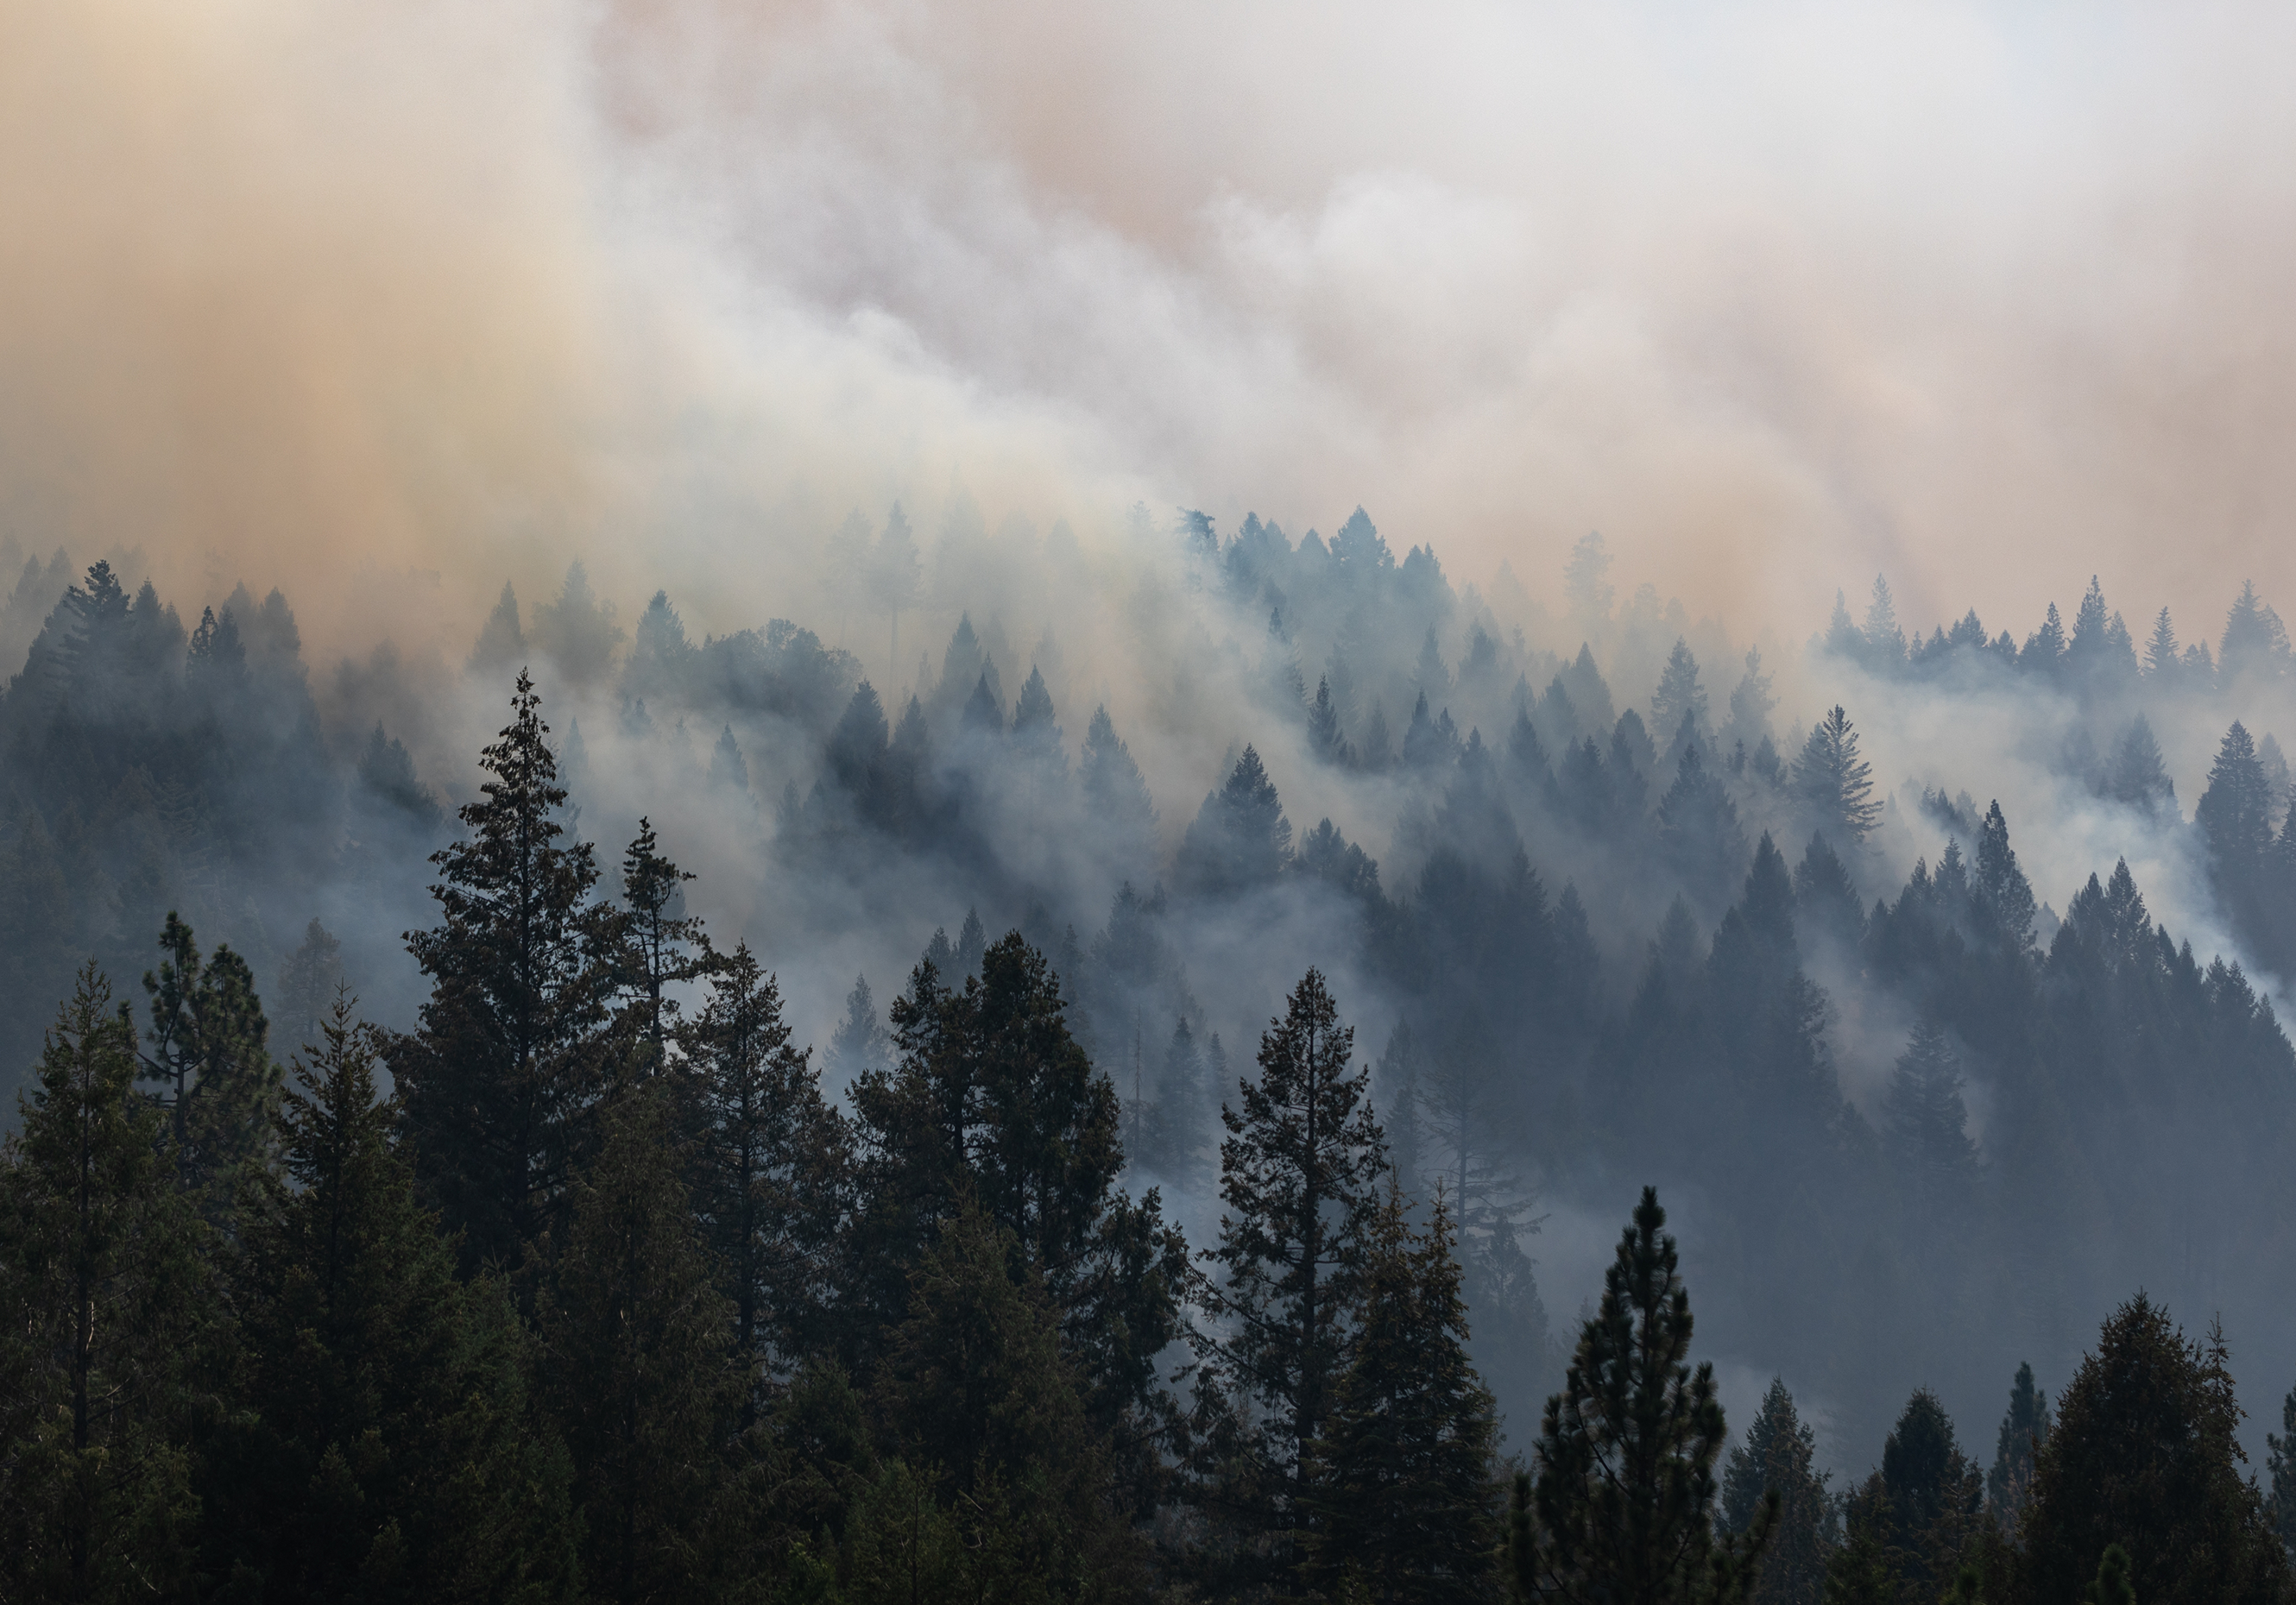
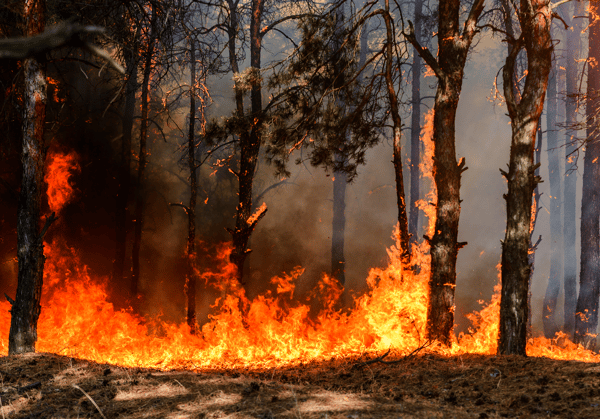 Wildfires are becoming an increasingly common
occurrence due to climate change.
Related:
How Location-Based Data Improves Property Underwriting
How to reduce wildfire risk concentration
Scores alone aren’t giving insurers enough information. To assess true loss potential, insurers need a clearer picture of risk aggregation to prevent over-saturation. Mapping helps insurers visualize the location of risks and their proximity to each other, offering a more complete look at exposure and creating opportunities to improve risk management.
Let’s illustrate how this works with two hypothetical scenarios, both in places highly likely to be exposed to wildfire. In fact, these two places both rank in the top five of the Washington State Department of Natural Resources’ (DNR) Community Exposure Rating, which is based on a high likelihood of a wildland fire occurring and a high population.1
We’ll start with Wenatchee. In this first map, the blue and pink points are address points in the area; they represent homes and businesses. The pink points are within one mile of a past wildfire, and the perimeters of those fires are also marked, as are the years of the fires. One underwriter has written policies on just .1% of all the address points in Wenatchee. The black dots show properties in that individual underwriter’s book.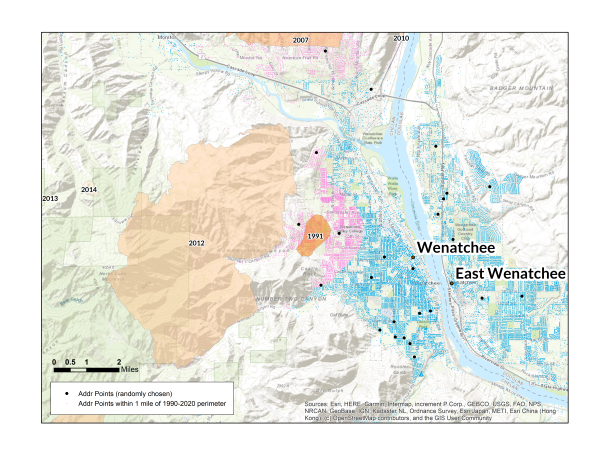 But in this scenario, there isn’t just one underwriter at the insurer who writes policies on properties in Wenatchee. The next underwriter has more business in the area, but still a seemingly small share of the possible total. This underwriter has written policies on .3% of the properties.
 There are two more underwriters covering the area, and each of those also has .3% of the total properties. That means the insurer’s total share of the wildfire risk in the area is 1% of all addresses, the significance of which doesn’t become clear until you see a map.
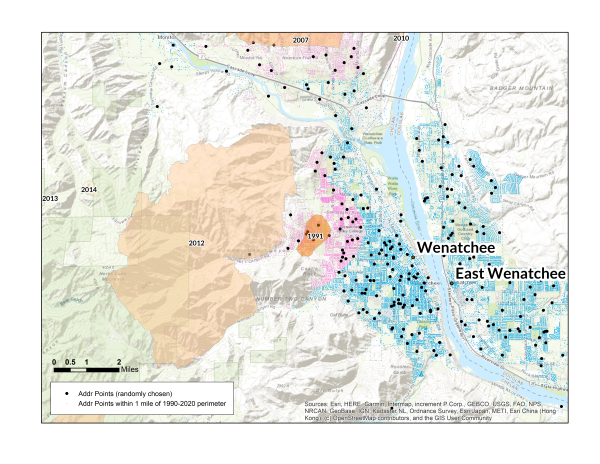 Let’s look at another area, one that’s more populated: Spokane.
Again, our first underwriter has written policies covering just .1% of all the address points in the area.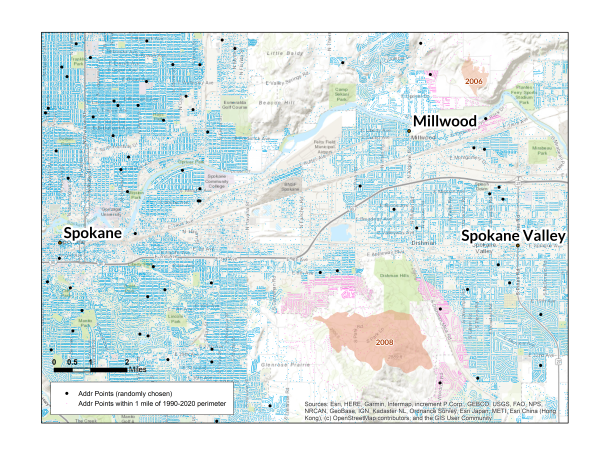 The next underwriter has covered .3% of the addresses.
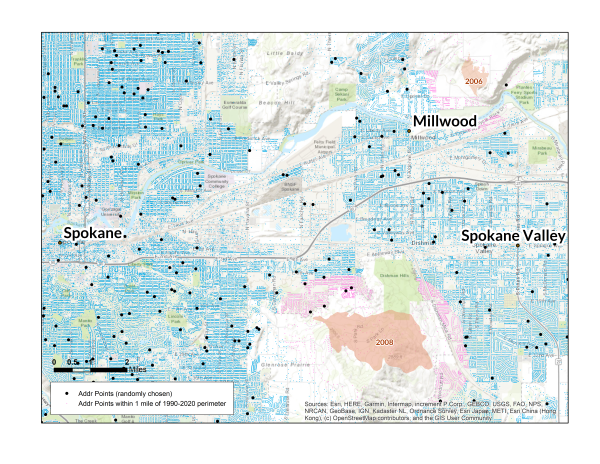 Another underwriter has taken on 1% of all the addresses.
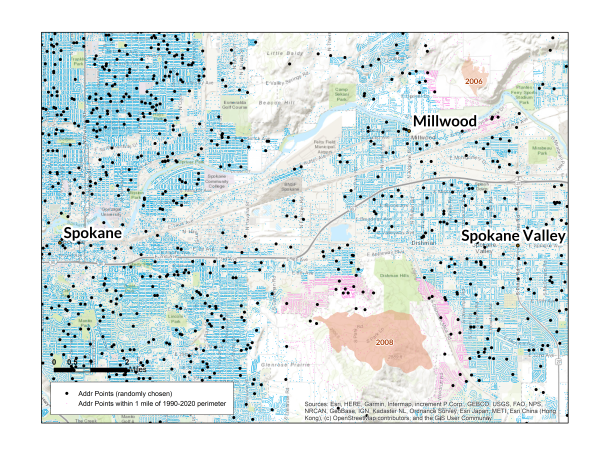 This insurer has a total of seven underwriters covering Spokane, but most of them — four of them — have just .1% of the area each. Two have .3%, and only one has 1% of the total. Those small numbers add up quickly. The insurer now has 2% of the risk in the area, which looks like the following.
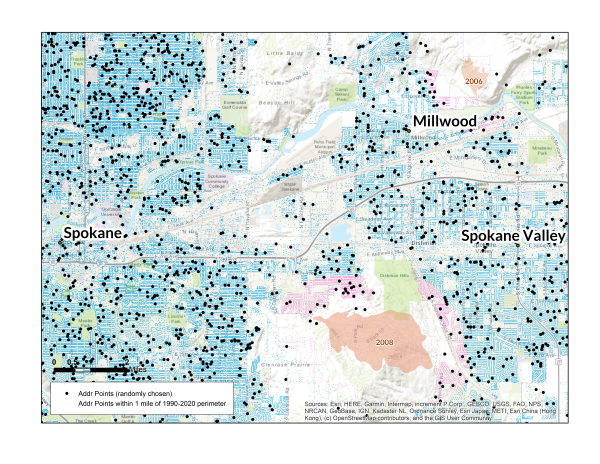 If a wildfire burns through either Wenatchee or Spokane, which the DNR tells us is likely, the insurer could end up having to pay out a significant amount all at once, potentially straining its financial stability. If a reinsurer notices this concentration of risk, the insurer could face tough questions at the next reinsurance review.
The superior alternative is to be prepared, to know your concentration of risk now so you can determine whether it aligns with your goals or needs to be reduced. Maps like the ones above offer a quick, easy way to see which locations in your book of business need a closer look.
Would you like to see a mapping analysis of your book of business? If so, contact us today, and we’ll guide you through the next steps.


[1] Washington State Department of Natural Resources, https://www.dnr.wa.gov/publications/rp_wildfire_strategic_plan.pdf?lmvb8d