
Wildfire is a rapidly evolving risk, and it’s posing an important question for property insurers: How do we manage our concentration of risk in near-real-time?
Historically, insurers have relied on their reinsurers to help them measure and manage their concentration of risk, also referred to as risk saturation. But this approach, which involves annual or semi-annual checks of a book of business, can no longer keep up with quickly changing risks like wildfire.
Instead, insurers need an easy way to track how much wildfire risk they’re accumulating in specific areas throughout the year. This way, they can avoid too much risk in a wildfire-prone area. Or, if the insurer prefers to take on more wildfire risk as a potential path to higher profits, it can use near-real-time tracking to identify opportunities.
For many insurers, spreadsheets are the standard tool for tracking and measuring risk saturation. However, spreadsheets don’t make it easy to quickly see where risk is concentrated or to draw useful conclusions about what to do next. And when an underwriter is considering a new policy, it’s time-consuming to use a spreadsheet to analyze the property’s location relative to the location of existing policies.
How maps help you reduce your wildfire risk saturation
Maps help insurers overcome all these challenges and quickly see, assess and act on risk saturation. As the saying goes, a picture is worth a thousand words. For an insurer, the right map is worth a thousand data points. Let’s explore how this works and how you can use maps to make more-informed decisions more efficiently.
We’ll start in Santa Rosa, California. Each orange house icon below represents a single property in a simulated insurer’s book of business. On its own, this map already makes understanding where your risk is located faster and easier than examining row upon row of addresses or latitude-longitude pairs and then calculating distances in Excel.
You can instantly see if you have primarily written policies near the center of town — where the highways meet and where wildfire risk is likely lower — or on the outskirts where wildfire risk is likely higher. But pairing this data with another geospatial layer will make the map even more useful.
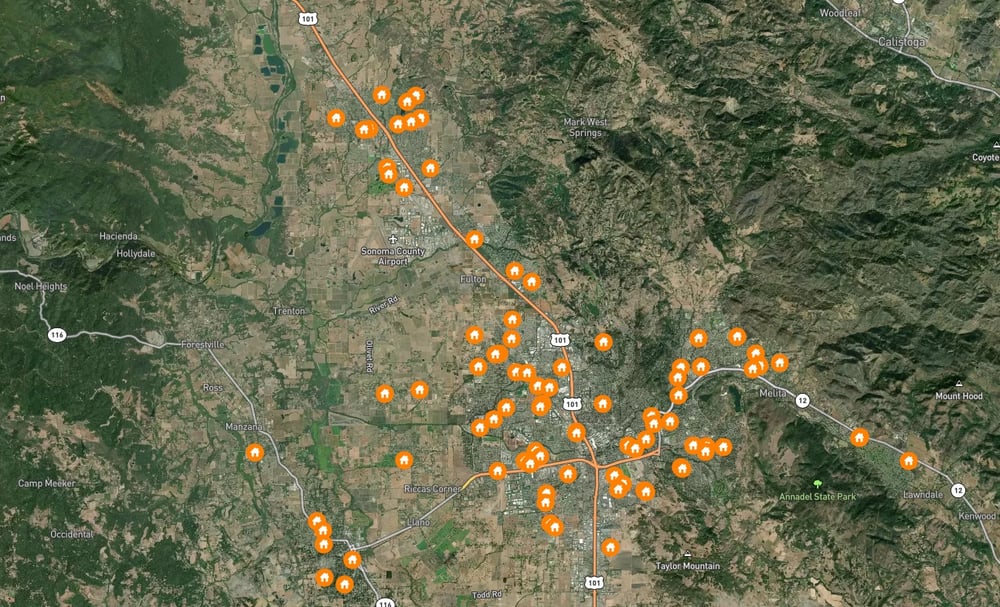 Each orange house icon represents one property in a theoretical insurer's book of business
in Santa Rosa, California.
Here is the same location and the same set of insured properties with the perimeters of recent wildfires added. Between 2010 and 2019, two fires burned north of Santa Rosa: the Kincade fire in 2019 and the Tubbs fire in 2017. Last year, the Glass fire burned east of town, and the Wallbridge fire burned to the northwest. This visualization shows you where you’ve written policies compared to where wildfires have burned in the past. You also see, in a general way, how wildfire-prone the area is.
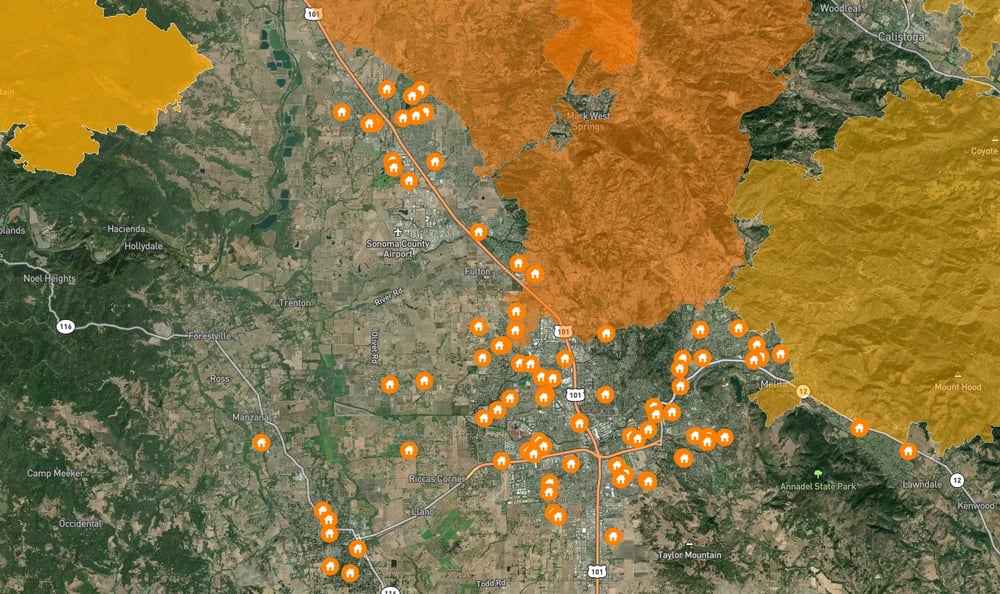 Recent wildfire perimeters for Santa Rosa, California show
several fires have burned in the area since 2010.
Related:
Managing Concentration of Risk: The Power of Maps
Let’s move to Southwest Oregon, where our simulated insurer has written many properties near the highway and several to the east. We’ll start by looking at the properties in relation to wildfires that burned between 2010 and 2020.
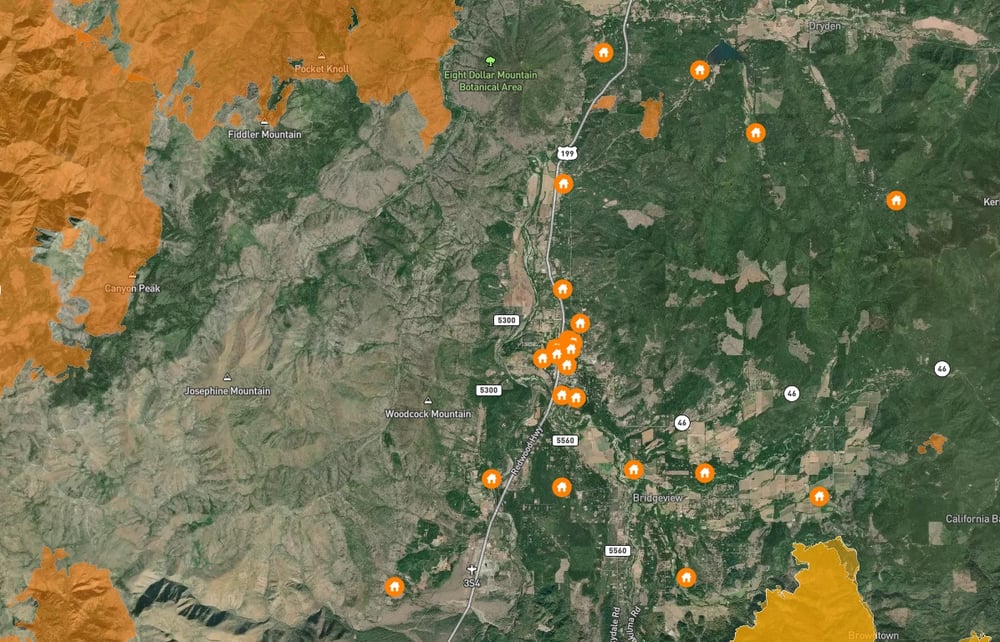 Between 2010 and 2020, several wildfires burned in Southwest Oregon,
threatening properties in the area.
Next, we’ll add perimeters from wildfires that burned between 2000 and 2010 so you can see the full recent history at once.
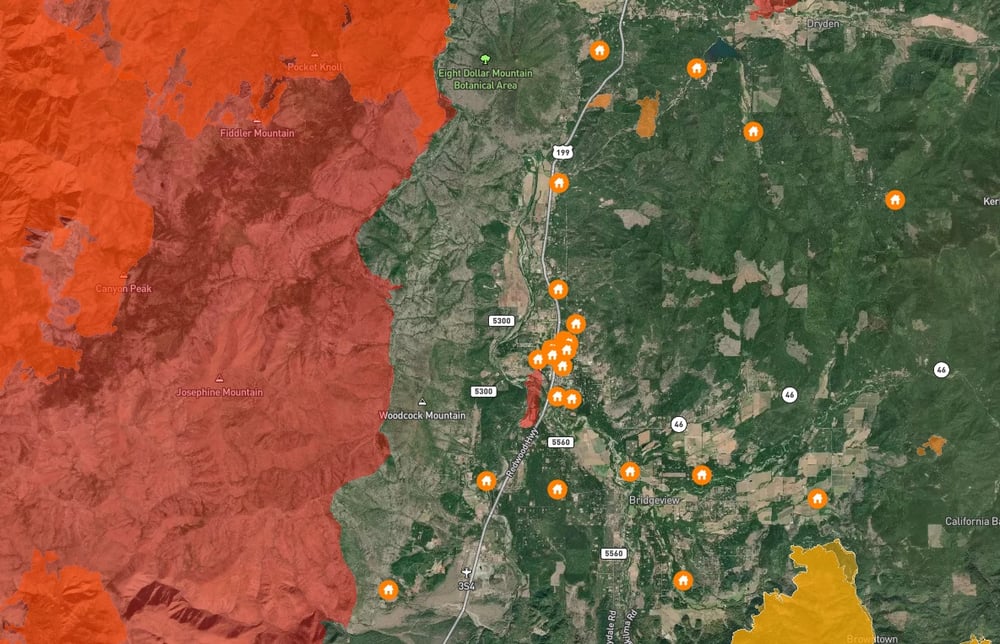 A large share of this area burned in 2002, and that area may already be prone to another fire.
Related:
Infographic: A Look at Recent Wildfire Seasons
The large area that burned to the west ignited in 2002. While that doesn’t seem especially long ago, enough time has passed to allow the regrowth of vegetation that fueled this 2002 fire. After a wildfire, there’s not much vegetation, but that effect only lasts about 10 years.1 In other words, a decade or more after a wildfire, enough vegetation has typically grown back to fuel another fire. In fact, some parts of the U.S. West have burned, on average, every seven years in the last 70 years.2 We explore this trend in more depth on the WSRB blog.
Let’s look at one more area, this one in Southern California. Santa Clarita is in the hills northwest of Burbank and Pasadena. The first map shows the properties insured in the area along with wildfire perimeters from 2010 through 2020.
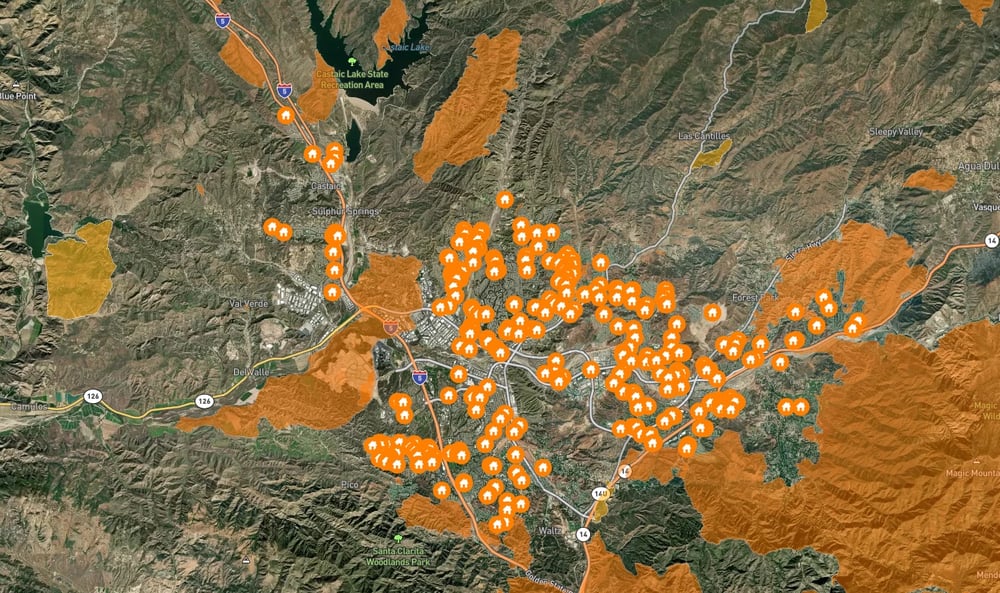 A significant amount of land near Santa Clarita, California has been burned by wildfire since 2010.
Next, let’s add the wildfire perimeters from 2000 through 2009 and show all recent burns at once.
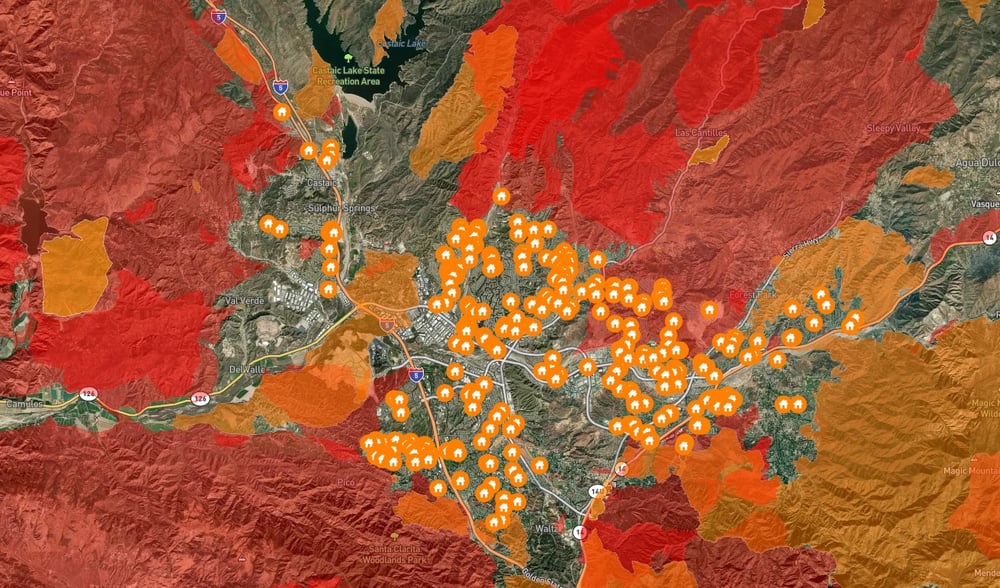 Between 2000 and 2020, the vast majority of the area surrounding Santa Clarita, California has been burned by wildfire at least once.
That’s a large area where vegetation has had time to grow back and potentially burn again. Some of the past wildfire perimeters now have properties within them.
With maps, it requires just a few moments to take in and analyze this data versus trying to review multiple spreadsheets. Maps enable you to rapidly and accurately assess your wildfire risk concentration and determine the next best step for your business, be it writing more policies in the area to maximize potential profits, no longer writing new policies in the area to reduce potential losses, or anything in between.
Underwriters can also easily view this data for an entire area at once, not just the books they individually manage. As a result, underwriters can more effectively support company-wide objectives. Underwriters can also look up a property they’re considering insuring and instantly see how its location compares to wildfire perimeters. In short, maps like these make it easier for underwriters to make more informed decisions about properties in dramatically less time.
Would you like to see your book of business mapped in a similar way? We’re happy to help you and provide a demonstration of a solution that makes this process easy. Although we’ve talked exclusively about wildfire in this post, mapping multiple other perils, including hail, earthquake, flood, and cannabis is just as easy. Contact us today.


[1] IOPScience, https://iopscience.iop.org/article/10.1088/1748-9326/ab6c70/pdf
[2] Idaho State University, http://giscenter.isu.edu/research/Techpg/nasa_RECOVER/pdf/GeographyWildfires.pdf