
If you insure property in the Western U.S., you know a severe drought is spreading throughout the region. Scientists are predicting the drought will continue to worsen, meaning the potential for serious wildfire-related losses will likely grow. What you may be wondering is how you can address this risk to help minimize your losses.
The sooner you can understand the extent of the risk in your book — and more importantly, exactly where the risk is — the sooner you can act to reduce the drought’s impact. We have three solutions to help you address the wildfire risk in your book of business, which we’ll tell you about shortly. First, let’s briefly explore publicly available data sources and what they tell us about the severity of the drought.
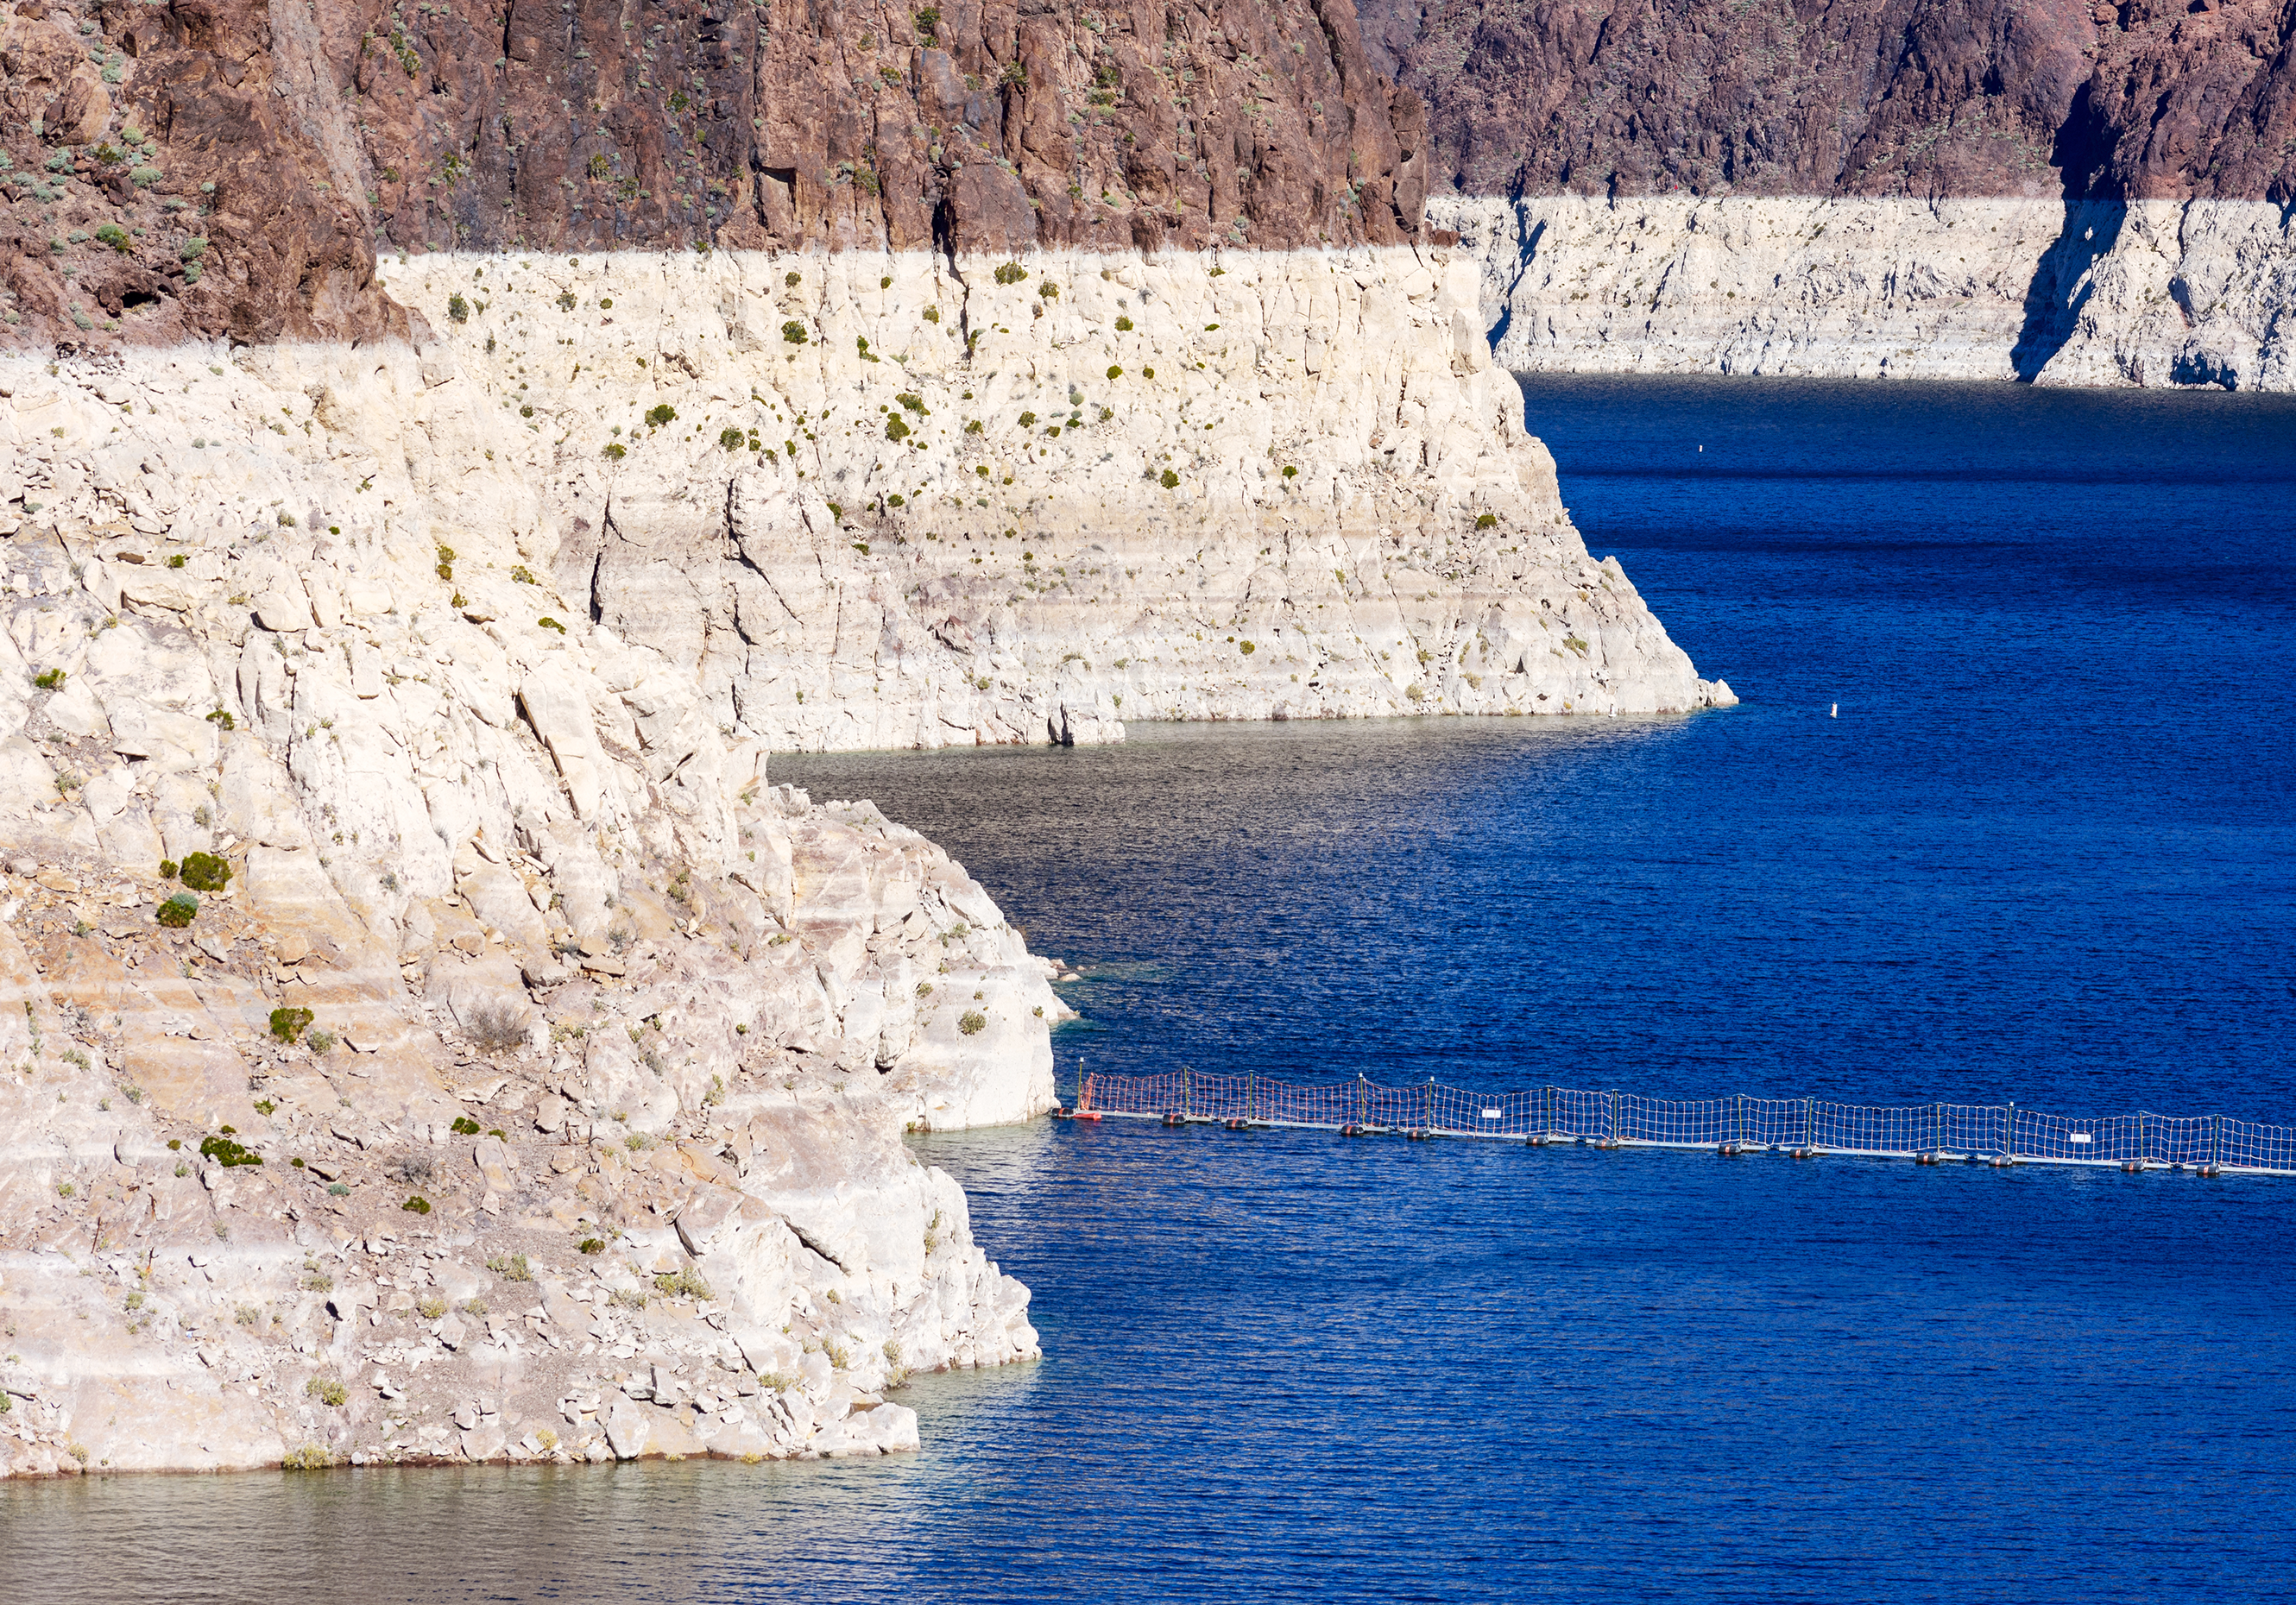
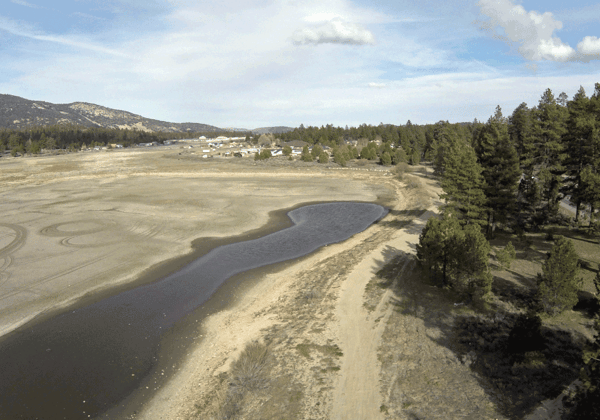 The drought in the Western U.S. has led lake levels to plummet in some places.
Related:
A Hard-to-Spot Risk: Adult Family Homes
What data can I use to assess drought-related property risk?
There’s a wide variety of data available showing just how bad the drought is and the regions it’s affecting, including the U.S. Drought Monitor and the Crop Condition and Soil Moisture Analytics tool. These data sources give underwriters a general sense of the areas that face elevated wildfire risk this year and potentially in the years to come.
For example, this western from 2021 drought monitor shows 47.03% of the region — primarily in Nevada, Colorado, Arizona, Utah, and New Mexico — is in extreme or exceptional drought.

Much of the Western U.S. is facing severe, extreme or exceptional drought.
Click on the image for a larger version.
Compare that to the drought conditions in the same region in late April 2020,2 just before the California wildfire season started with a 2,060-acre fire in Kings County. Major fires burned in multiple places throughout the spring and summer, with some of the most destructive fires starting in August and September.3
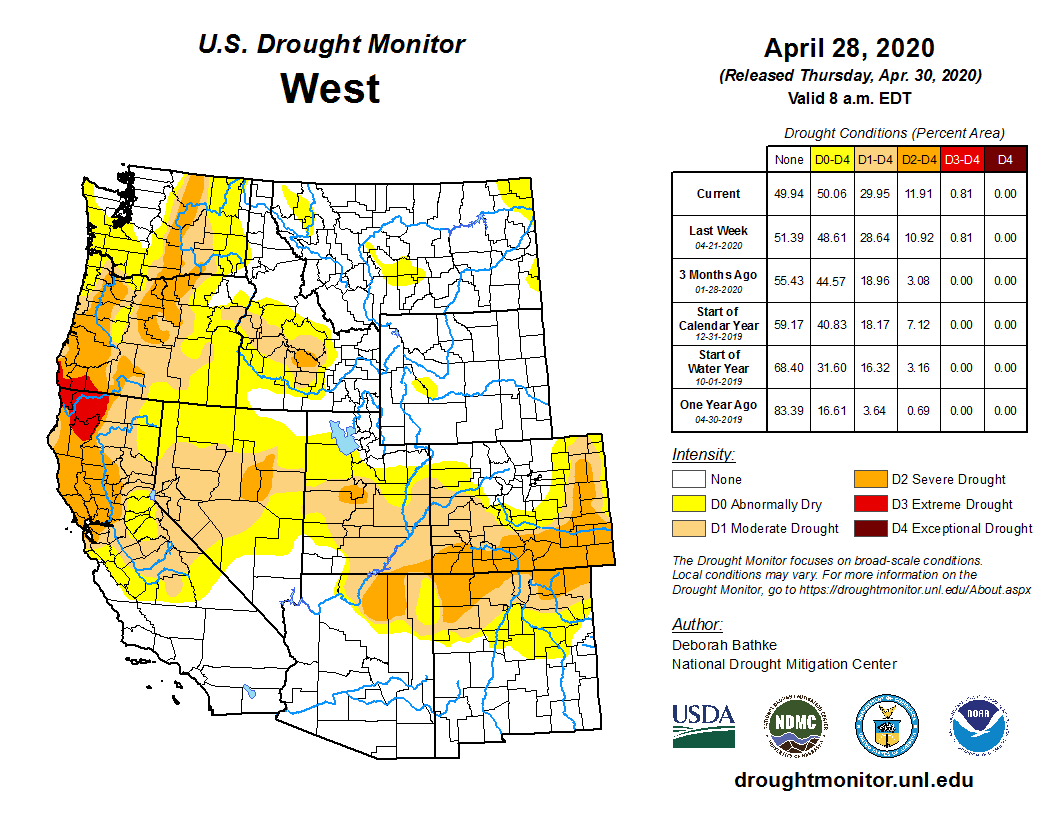 The drought was much less severe last year, just before the California wildfire season started.
Click on the image for a larger version.
Let's turn now to the crop condition tool, which shows you soil moisture levels compared to average levels. Low soil moisture levels mean vegetation is drier and more prone to burn if a wildfire starts. 2021 data from the crop condition tool showed that almost a quarter of California had soil moisture readings that were around 40% or lower compared to the average.
Specifically, categories one, two and three in the table below show the number of acres and the percentage of the state that have soil moisture readings of 70% below normal, between 70% and 50% below normal and between 50% and 40% below normal, respectively.
In addition, 68% of California has soil moisture levels that are between 10% and 40% below average.4 In other words, most of the state has dry or very dry soil.
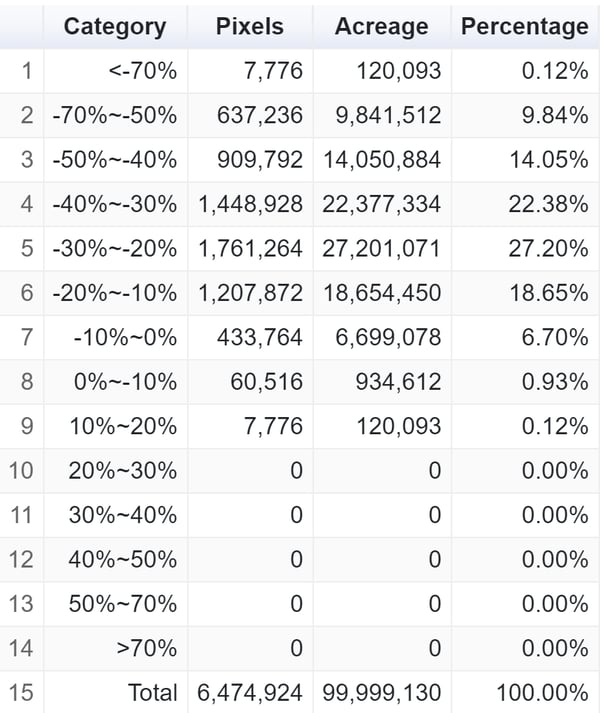 Soil moisture levels in California are far below normal for much of the state.
Soil moisture levels and drought severity are not perfect predictors of potential wildfire damage, but this data helps you understand the potential overall impact of the drought, and it shows now is a key time to look at your book and determine what you want to do next.
Related:
Infographic: A Look at Recent Wildfire Seasons
What data can help me address my wildfire risk?
To assess and address the wildfire risk in your book, you need the right data. The drought monitor and soil moisture data sources don’t enable you to quickly, efficiently and accurately identify which properties you already insure are in the hardest-hit areas. That makes it difficult and time-consuming to figure out which properties are most susceptible and require immediate attention.
The drought monitor and soil moisture data also can’t help you evaluate specific properties you’re considering insuring. As a result, they don’t power precise underwriting decisions.
We now offer multiple tools to help you evaluate the wildfire risk facing the properties in your book, all of which give you valuable data on the specific properties you currently insure and any properties you’re evaluating for a new policy.
- Advanced, interactive geospatial technology. See detailed data on vegetation, current and past wildfires, wind patterns, and more. You can monitor wildfires in near real-time with satellite data. And, you can view the concentration of risk for any area you select, in terms of both policy counts and total coverage limits so you can address your potential for catastrophic losses. Contact us to learn more.
- Mapping services. See, understand and manage your concentration of wildfire risk. Even if each of your underwriters takes on only a small amount of property risk in a wildfire-prone area, the total amount in your book can quickly add up. See an example of how this works. Our mapping services show you where you have more risk than you want so you can reduce your potential losses.
- The Wildfire Risk Tool. Get address-specific data on whether a property is in the wildland-urban interface (WUI) and whether wildfires have burned nearby in the past. The WUI is where development and wildland meet, making it especially prone to wildfires. A pattern of past wildfires also makes a location prone to wildfires, and many places in the West see repeat wildfires every few years. The Wildfire Risk Tool gives you address-specific data on these key risk factors. If you’re a WSRB Subscriber, Washington state data is included in your subscription.
Contact us to learn more about any or all of these tools.

[1] U.S. Drought Monitor, https://droughtmonitor.unl.edu/Maps/MapArchive.aspx
[2] U.S. Drought Monitor, https://droughtmonitor.unl.edu/Maps/MapArchive.aspx
[3] Wikipedia, https://en.wikipedia.org/wiki/2020_California_wildfires
[4] Crop Condition and Soil Moisture Analytics, https://cloud.csiss.gmu.edu/Crop-CASMA/