

Diversification is a common risk management strategy, limiting exposure to any single type of risk and avoiding catastrophic loss by writing a broad spectrum of different types of risk across various regions.
In terms of property insurance, this type of strategy requires a level of geographical awareness, knowing where properties exist geospatially to ensure adequate diversity of risk concentration. In other words, if you don’t know where things are on a map, how can you be certain exactly where your risk exists and the concentration in any given area?
We've developed tools that give underwriters the ability to visualize and understand their risk concentration geospatially. By plotting geographic locations in your book of business, we can not only reveal the concentration of risk within your book but also risk that is in close proximity to the properties you insure.
 A list of addresses can sometimes obscure the
concentration of risk in your book of business.
Related:
The Costs of Insuring Cannabis Businesses
Visualizing risk geospatially
Imagine you are an underwriter. You have a spreadsheet of many different addresses which your company currently covers. It looks something like this:
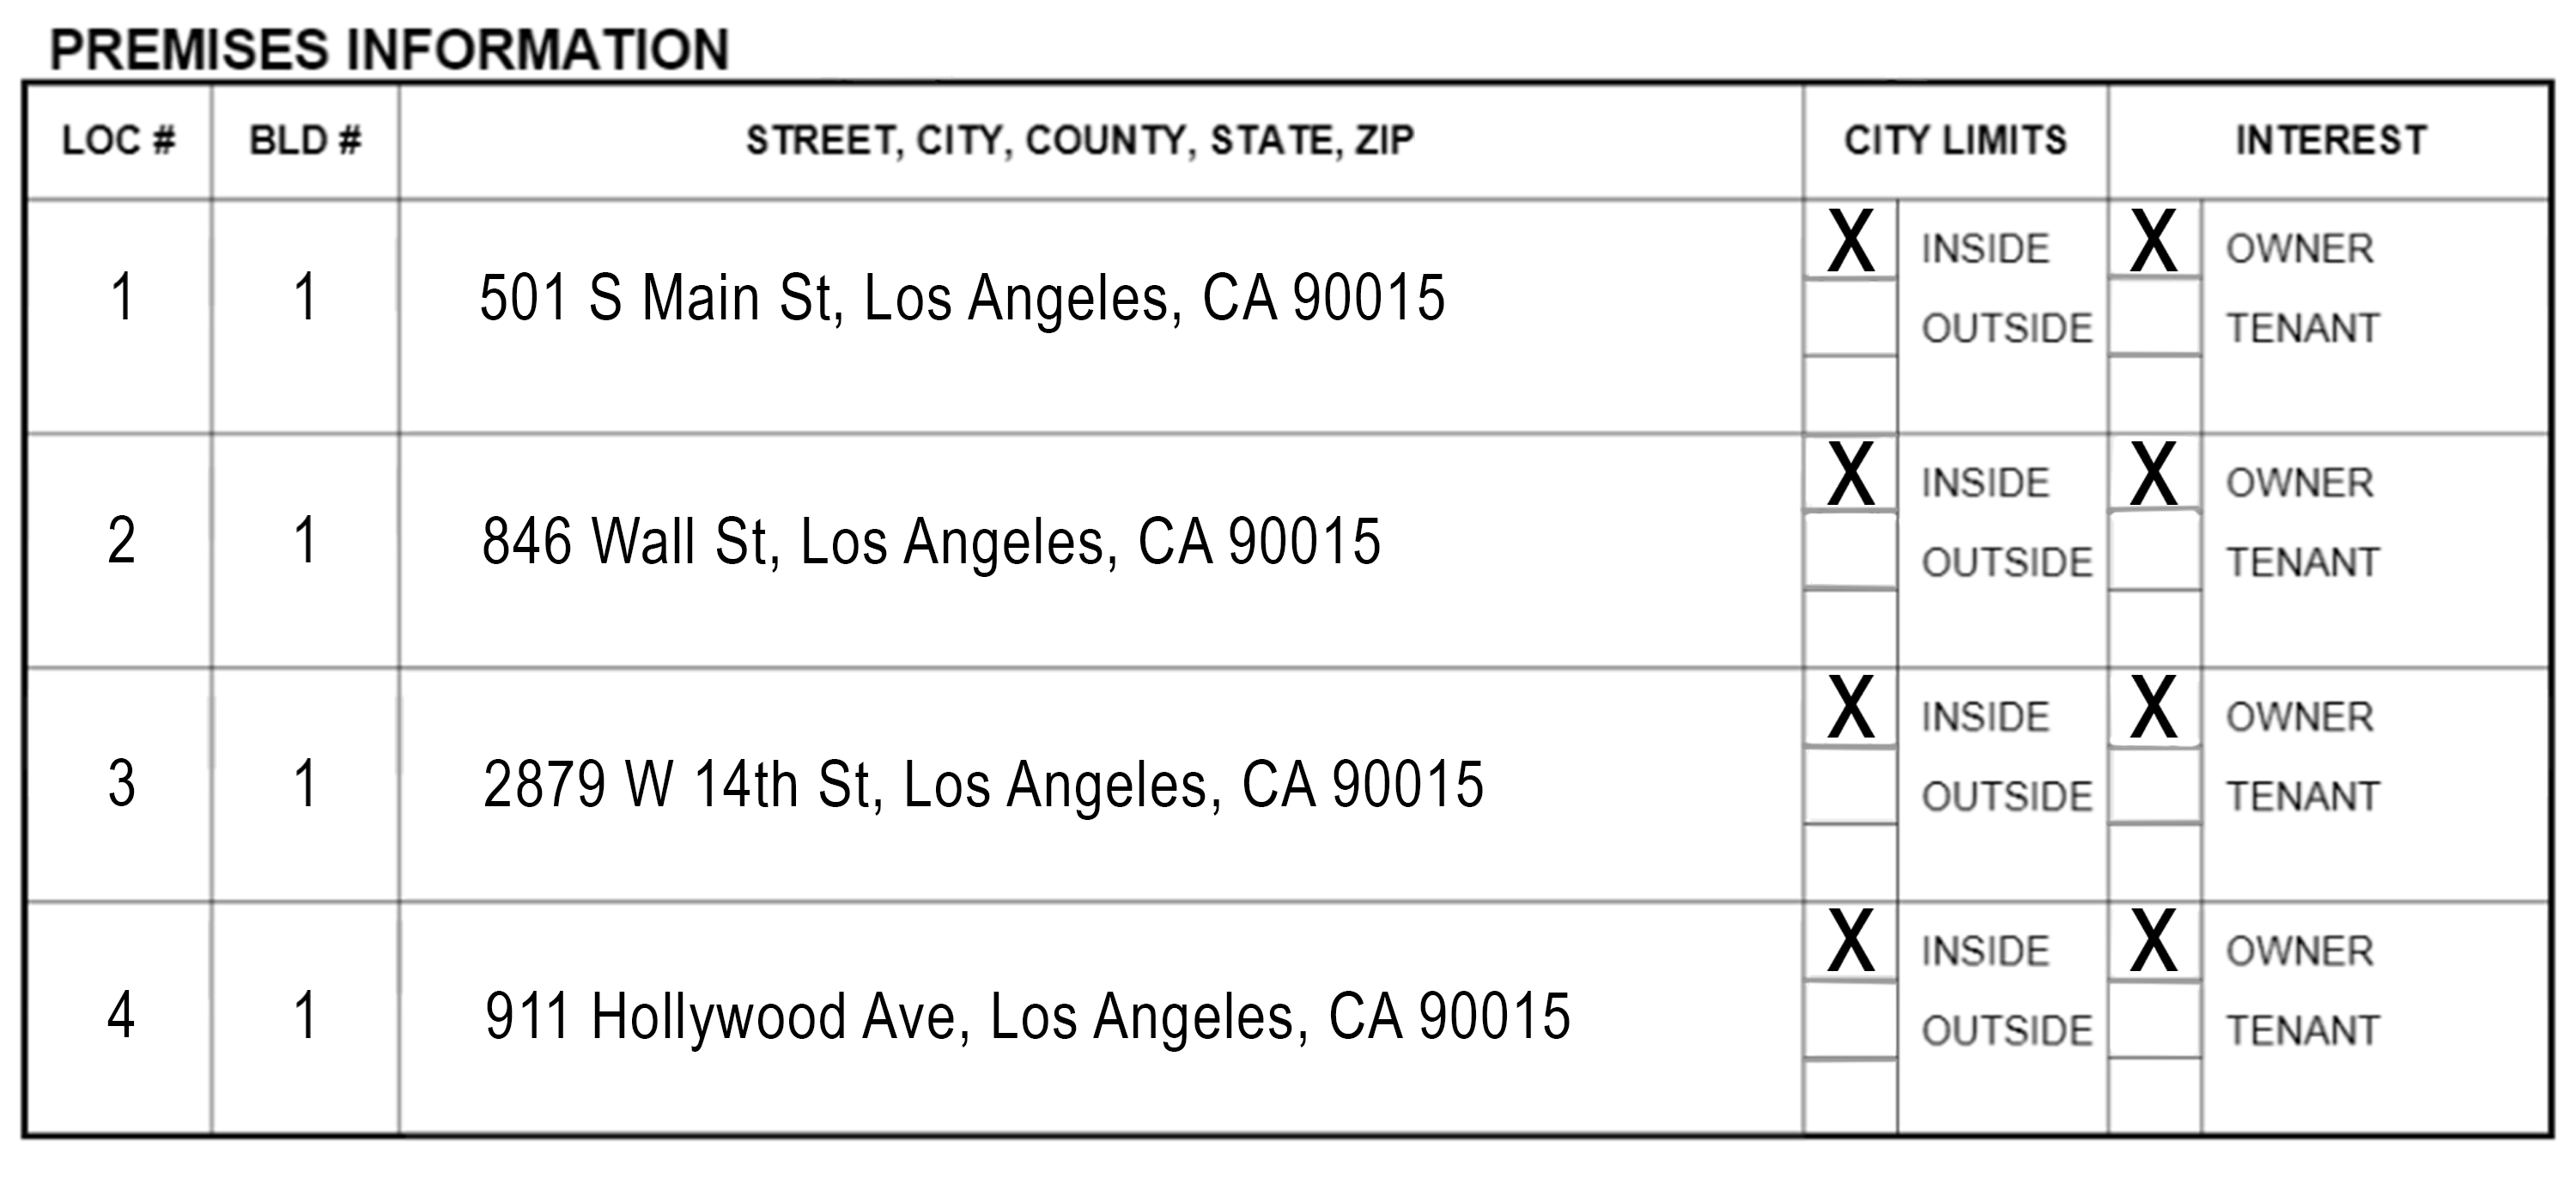
Just looking at this spreadsheet, you can see that the addresses are all unique. It wouldn't be too much of a stretch to assume that none of these properties are near each other. Instead, let’s take these same addresses and plot them out geographically:
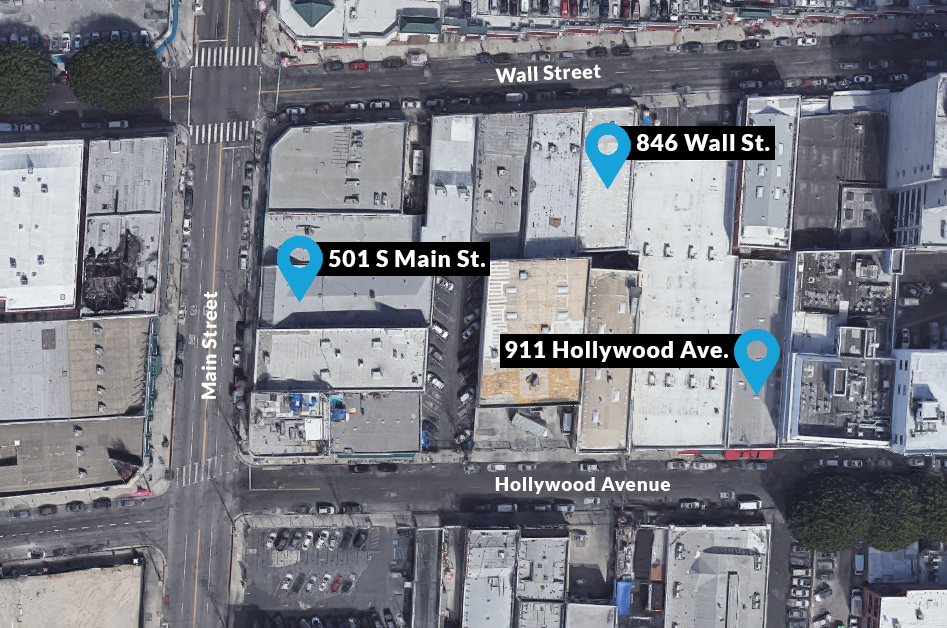
Look! Three of these addresses are much closer together than we first assumed. In reality, your risk is more concentrated than you thought. This alone can help guide your thinking and help to mitigate your exposure.
However, this type of data visualization can do much more. Not only are we picking up a direct hit for the addresses that exist in your book of business, but we can also run that data against known exposures we have sourced.
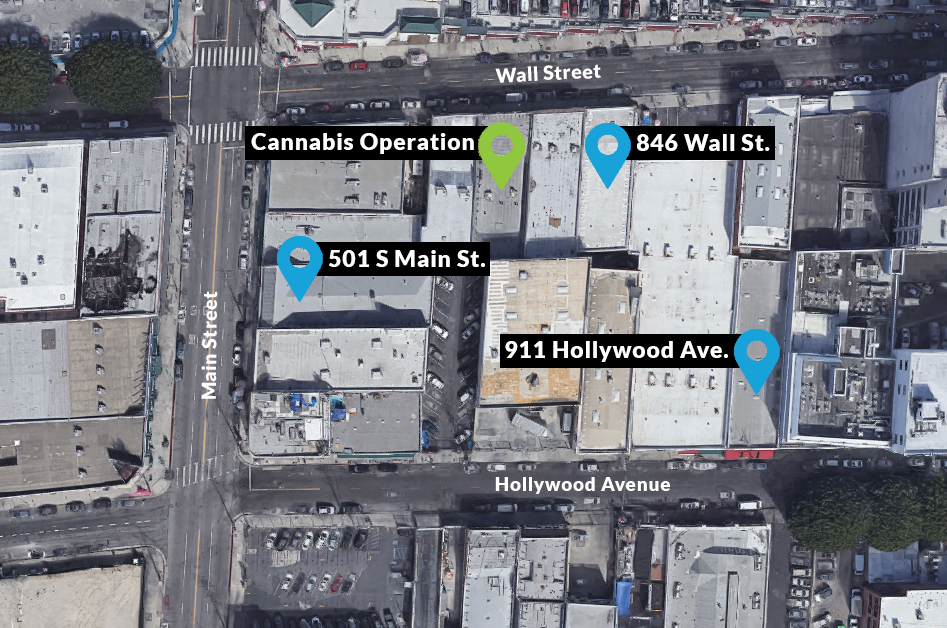
Let’s say your company does not cover cannabis operations: it's too much risk and you’d rather play it safe. But what if an address nearby to one of the properties you insure is a cannabis growing operation?
Using maps, you can clearly see that several of the addresses in your book of business are within close proximity to this cannabis operation. Even though you do not cover cannabis facilities, you are exposed to the potential hazard and ramifications of fire or explosion that are common with these operations.
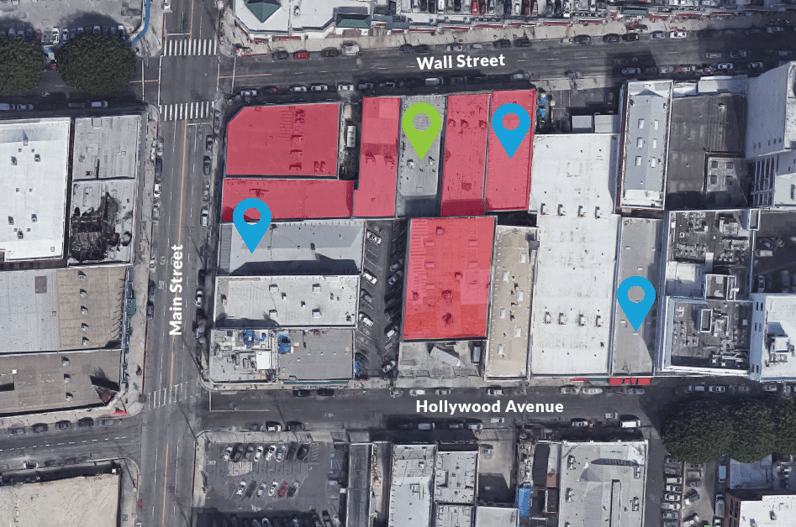
Buildings in close proximity to the cannabis operation could also be damaged given the density of the area, something that mapping exposures allows you to fully understand.
While maps, like the examples above, are an important part of understanding the power of our tools, we can provide you with the concentration and proximity of risk data without needing a map. Our process provides you with easy-to-understand data using your book of business.
Harness the power of maps
So, there you have it. The power of maps cannot be understated. It gives you the ability to see a clearer picture of risk in a shorter timeframe.
Without this type of geospatial technology, underwriters are not getting all the information to better help them evaluate risk. It is harder to visualize the concentration of risk and any adjacent exposures from basic spreadsheets. There simply is not enough time in the day to figure all this out without the correct tools. In addition, risks like cannabis processing centers often don’t show up on traditional maps, making it nearly impossible to identify their proximity to properties you cover.
Not only does geospatial technology give you a picture of your risk concentration, it also offers you the ability to see known exposures and how they might affect properties within your book of business. Using your book alone does not give you the ability to see the proximity to other forms of risk.
Learn more about our geospatial tools and how they can help your business.
If you want to learn more about how to reduce cannabis property risk, check out some of our content on the subject or contact us. Our cannabis occupancies service, CannabisFind, offers up-to-date, validated data on each insured location in your book, enabling swift identification of cannabis operations currently covered under personal lines policies.