Guide to Earthquake Risk
Help your customers understand and be covered for earthquake risk.
Look beyond fault lines to gain a comprehensive understanding of earthquake risk.
How to use this guide
In this guide, we've compiled information regarding earthquake risk, including steps to minimize these risks and effectively market earthquake policies to homeowners who need coverage. In each section, we provide links to additional articles from our blog, allowing you to learn more on any given subject.
BuildingMetrix® is proud to be a part of WSRB, which has inspected properties, evaluated communities, and helped insurance companies understand and underwrite risks in Washington state for over 125 years. While WSRB's original focus was fire risk data, BuildingMetrix was created to help our customers understand new and evolving risks, including earthquake-associated risk. We have developed tools to help find and manage earthquake risks wherever they are found in the US.
When you partner with BuildingMetrix, you get access to valuable solutions, industry knowledge, and friendly, knowledgeable service for properties throughout the United States. Learn more about what we offer here.
Earthquake risk fundamentals
Various earthquake risk factors must be assessed and understood to make an accurate evaluation of any given property in earthquake-prone regions. Let’s look at some of the most critical pieces of the puzzle.
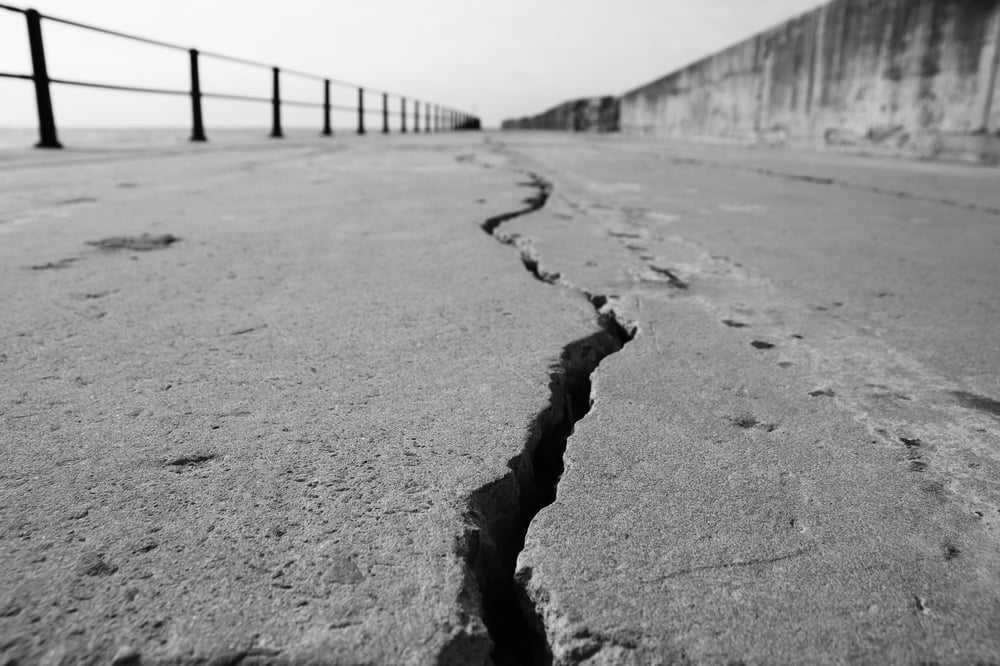
Distance to fault
Faults are where earthquakes originate, occurring when two blocks of earth slip past one another (learn more about how earthquakes occur). While this takes place below the earth’s surface, a place called the hypocenter, the location directly above on the surface of the earth, is designated as the epicenter of an earthquake.
Assessing a property’s proximity to a fault is of primary importance. Buildings located on faults are at increased risk of earthquake-related damage. California has outright prohibited new construction directly on or near fault lines due to the massive risk involved.
Soil type
The makeup of the earth's surface is not consistent. The ratios of rock, soil, mud, and artificial fill can vary wildly within relatively small areas. Earthquake impacts can be devastating depending on the area’s soil type. Based on the softness of the sediment, an earthquake’s power can be amplified or mitigated.
Seismic waves travel through the earth when an earthquake occurs. Hard rock allows these waves to move faster, while soft soil slows the progress of these waves, increasing the amplitude, or size, of the wave itself. Bigger waves cause stronger shaking, and stronger shaking leads to more damage.
In addition to amplifying the power of a quake, soft sediment is prone to a process called liquefaction, a state where saturated soil stops acting like a solid and starts behaving like a liquid. Shaking increases groundwater pressure on soil particles, pushing them apart and allowing water to make its way into previously packed soil. As more water is forced into the soil, particles are pushed further apart, resulting in soft, shifting earth that can buckle, break and sink.
Different soils have different levels of susceptibility to liquefaction. Liquefaction susceptibility can vary significantly within a small area, sometimes from block to block. Determining what type of soil exists at a specific location, including how compacted it is, the depth of the groundwater, and the quality of drainage, can assist in establishing the earthquake risk of a property.
Assessing the soil type on a property and its site classification is a crucial part of understanding how much impact an earthquake can have. For example, look no further than the Great San Francisco Earthquake.

Four out of every five buildings were destroyed during the quake.
During the 1906 earthquake in San Francisco, the Bay Area suffered immense losses – the city of San Francisco alone had 80% of its buildings destroyed.1 The 7.9 magnitude quake, felt in cities around the bay, was barely perceptible on the island of Alcatraz. While the surrounding land was made up of softer soil, amplifying seismic waves, the bedrock of Alcatraz allowed the waves to pass through quickly, resulting in minimal damage. An estimated total for the cost of damages on Alcatraz was slightly over $1,000 - compare this with the overall cost of $350 million in damage to the city.
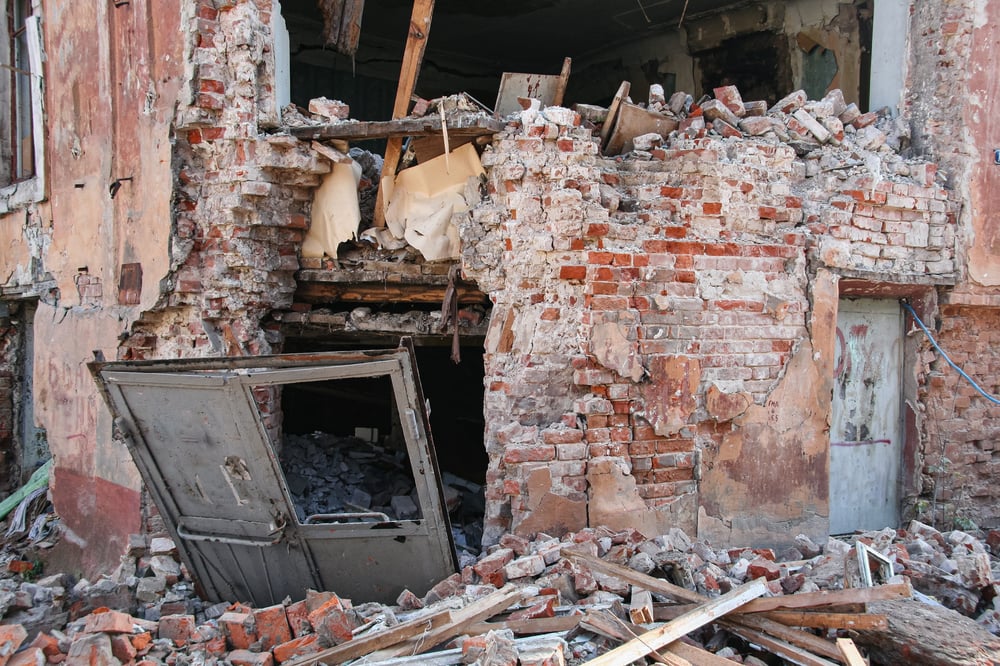
Construction
Some types of buildings can withstand earthquakes better than others, depending on construction features and what materials were used. Each building is given an earthquake classification, a designation meant to signify the potential property loss due to earthquake.
Earthquake classifications take into account building materials and various aspects of construction style. For example, buildings that contain a soft story, classified as a particularly flexible or weak level of a building that has minimal lateral load resistance, or have unreinforced masonry, such as exterior walls constructed using brick, concrete, or other materials are more likely to be classified as having higher loss risk.
Here’s a quick guide to the earthquake classification, along with some common exceptions and misclassifications. A building's earthquake classification is essential for developing a complete picture of a property’s earthquake risk.
Look beyond fault lines
Other risk factors influencing property risk from earthquakes include the area’s Modified Mercalli Intensity (MMI) Scale, lahar presence, and tsunami risk.
Modified Mercalli Intensity scale
The Richter scale tells you how much energy is released from the epicenter of a quake while the Modified Mercalli Intensity (MMI) Scale tells you the strength of shaking at a specific location. It helps property owners understand the degree of shaking that will occur when an earthquake strikes, measuring the intensity of ground movement to the structure. Thanks to the USGS, information is collected following a quake to determine its effect on people, structures, and the natural environment.
This information translates to an MMI score that ranges from I, not felt, to X, extremely violent shaking. Understanding the MMI for a property helps insurance professionals make informed decisions regarding earthquake risk.
Lahar
Lahar is a type of extreme mudflow composed of water, rocky debris, and pyroclastic material. These phenomena generally coincide with volcanic activity; lahars can also occur without an eruption, triggered by melting snow or, in some cases, earthquakes.
Washington state is particularly susceptible to this kind of disaster. A lahar from Mt. Rainier alone could be up to 100 feet thick, crossing populated areas with homes and businesses. According to the USGS, Washington has a high potential for earthquakes - accompanying lahars are a real threat if an earthquake occurs.
Tsunami
Computer models generate tsunami inundation maps, indicating areas of land susceptible to tsunami by utilizing topography, seismological studies, empirical evidence, and bathymetry (the measure of depth in bodies of water).
The data from these inundation maps can help you assess tsunami risk in an exact location, including the potential severity of inundation. Even though these maps are imperfect and cannot possibly incorporate every scenario, they provide a solid basis for how to address this increasingly critical issue along our coastlines.
Learn more about tsunami risk.
Landslide
More widespread than any other geological event, landslides occur in all parts of the world. Between 1998 and 2017, landslides affected an estimated 4.8 million people. In the United States, between $2 billion and $4 billion worth of landslide-related losses occur annually, with public infrastructure, businesses, homes, and human lives all falling victim.
Landslides are most likely to occur in areas of steep terrain that are saturated by water and prone to other geological occurrences, such as earthquakes.
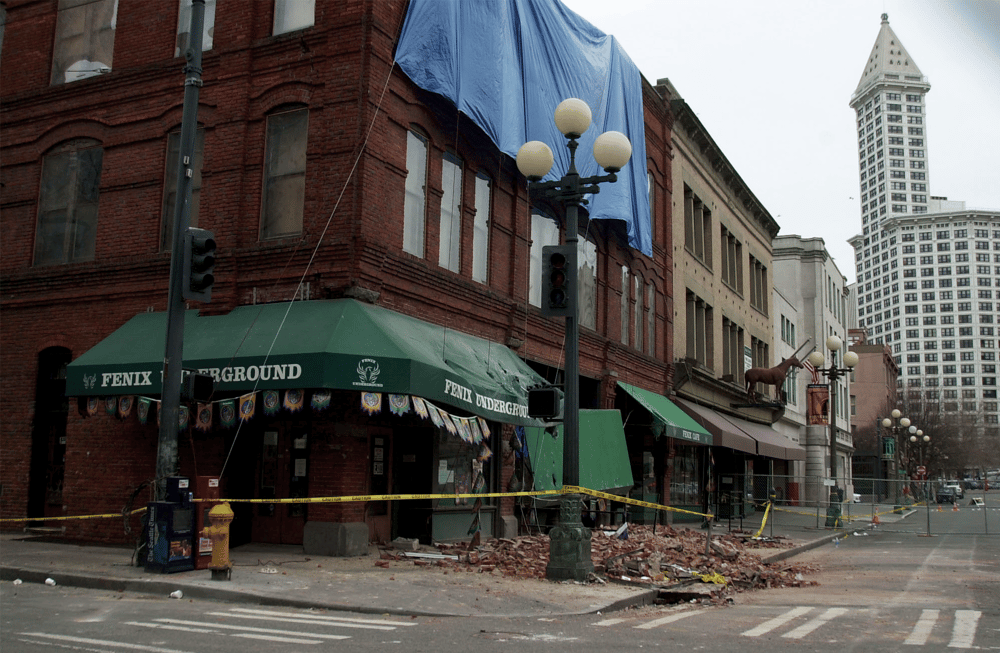 During the 2001 Nisqually earthquake, Seattle's Pioneer Square,
known for its historic brick buildings, was severely affected.
Specific risks in Washington State
Washington state is in a particularly vulnerable earthquake region. In fact, the USGS estimates there is an 83% chance of a magnitude 6.5 or larger quake in the next 50 years. For reference, the 2001 Nisqually quake had a magnitude of 6.8 – a magnitude that is roughly twice as big as a 6.5 magnitude. Analyzing the potential for very strong shaking levels reveals that Washington state has the second highest exposed population in the U.S.2
Unlike California, where fault lines are clear and near the surface, Washington’s faults are buried under glacial material or hidden away in forests. It’s taken until recently, the last 20 years or so, for scientists to finally begin to uncover and study the faults in the Puget Sound region. However, there are faults yet to be discovered and properly evaluated.
Mount Rainier, an active volcano, presents a massive risk of lahars. Lava flows, ashfall, or other volcanic phenomena are not the primary risks should the mountain erupt - lahars are. Towns like Orting and Puyallup are directly in the flood path and could sustain massive amounts of damage. For historical context, the 1980 eruption of Mount St. Helens in the southern part of the state provides us a window into the potential ramifications of volcanic activity in the area.
Liquefaction is also of concern. Liquefaction was present during the Nisqually quake in several places around Puget Sound. This illustration from the Pacific Northwest Seismic Network gives a good sense of how widespread the problem was.
Only 11.3% of homeowners and 43.2% of commercial properties purchase earthquake coverage in Western Washington, one of the most earthquake-prone places in the country.
Check out the Washington Geological Survey’s Homeowners Guide to Earthquakes for an in-depth look at earthquake risk in Washington state.
Now that you understand the risks that can increase a property’s propensity for earthquake damage, how do you find out which risks exist at a location in Washington state or other earthquake-prone areas of the United States?
 Using our tools, pinpoint your at-risk customers and power new sales.
Earthquake tool: QuakeScout
Target customers most in need
Nearly 90% of homeowners in Washington state lack earthquake coverage, now is the time to encourage your customers to protect their homes and to reduce your risk of errors and omissions claims. QuakeScout can quickly pinpoint your at-risk customers by getting individualized earthquake property risk data, helping to power new sales.
You can either manually search out earthquake risk for specific addresses or utilize our tools to run your entire book of business all at once. If you opt for a complete book review, you’ll see all the data available from QuakeScout in a single, easy-to-use spreadsheet - no more looking up addresses one at a time.
You can effectively educate and motivate customers to purchase earthquake coverage by using this comprehensive data.
Marketing kit
Efficiently market earthquake policies to homeowners who need coverage the most by showing them a full picture of their earthquake risk. Data on earthquake risk factors will only help your customers if they understand what that data means to them. That's why our earthquake marketing kit includes easy-to-understand explanations of each factor that you can share with customers.
As part of our earthquake marketing kit, you get a webpage with engaging, explanatory content that's branded with your agency's logo and has a direct link to contact you. You also get a marketing letter customized with each customer's risk factor data that you can email to them. Finally, you get a dataset with all your customers' risk information in one place, allowing you to quickly pinpoint the customers who most need coverage and assess the size of your potential opportunity.
These three elements give you everything you need to have informative conversations with your customers and help them get the coverage they need to protect their homes.
SlopeScout
Sloped terrain significantly amplifies earthquake exposure, increasing the likelihood of landslides, ground failure, and structural instability.
SlopeScout, WSRB’s proprietary tool, gives insurers a fast, clear view of a property’s elevation and topography. With just an address, you can generate a detailed report showing how the building footprint aligns with the surrounding slope—critical for evaluating risk in seismically active areas. Whether underwriting new policies or reviewing existing ones, SlopeScout helps insurers make informed decisions when slope and earthquake vulnerability intersect.
Access SlopeScout today - it’s included with your WSRB subscription.
Learn more about SlopeScout
Still have questions?
We hope this guide and the linked articles gave you new insight into earthquake risk. If you'd like to learn more, contact our risk data experts.
[1] Alcatraz History, https://www.alcatrazhistory.com/rock/rock-019.htm
[2] USGS, https://www.usgs.gov/news/featured-story/nearly-half-americans-exposed-potentially-damaging-earthquakes